Download
1 / 12
120 likes | 421 Views

E N D
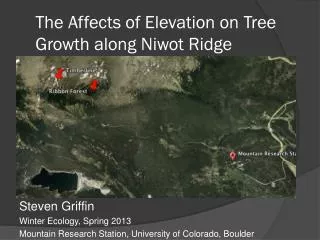
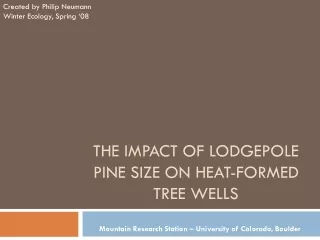
1. The effect of tree density and height on tree-flagging of Lodgepole Pines in Niwot�s sub-alpine forest Michael D. Schuster
2. Mechanisms of tree flagging Predominately carried out by wind
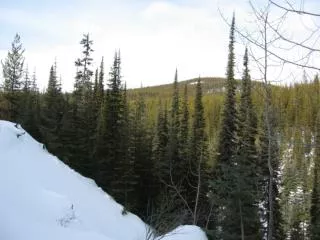
Krummholz: �Crooked Wood� in German; These are the type of trees/shrubs near or at treeline
Reasons for bareness of trunk: lack of SR
What I�m actually studying is not specifically krummholz, but rather the height at which the trees begin to have photosynthetic organs (needles, in this case). The factor that influences this is the amount of sunlight that penetrates the foliage. Beyond a certain threshold of light, the tree will not make needles on its branches.
This could be affected by other factors as well. If the snow depth is too high and covers enough of the needles, those needles will die.
3. In the Big Picture Why is this important?
Useful for forestry practices
Can put in context of CC scenario
Affects passage of mammals Forestry practices: If you want to have a plot with foliage down to the ground, or foliage that begins high up (good for skiing), how do density of the trees and height of the trees need to be considered?
Put in context of warming scenario: Would foliage extend downward, upward, or remain the same?
Passage of mammals: If there is less foliage at the ground, it is easier to move through the trees; but prey is more exposed. If the foliage is close to the ground, it will be harder for large mammals to traverse�more small mammals in that area?
Forestry practices: If you want to have a plot with foliage down to the ground, or foliage that begins high up (good for skiing), how do density of the trees and height of the trees need to be considered?
Put in context of warming scenario: Would foliage extend downward, upward, or remain the same?
Passage of mammals: If there is less foliage at the ground, it is easier to move through the trees; but prey is more exposed. If the foliage is close to the ground, it will be harder for large mammals to traverse�more small mammals in that area?
4. Observations and Hypothesis I noticed that the trees had varying heights of bare trunk and branches, and this general height changed when the trees were either taller or closer together
Hypothesis: affected by amount of sun reaching lower branches, not by krummholz or wind as much
As the avg height increases, the height of the bare tree will also increase
As the L.P. Pine density increases, the height of bare tree should also increase (more trees-more coverage-less sun to ground)
5. Methods 10x10 m transect
Clinometer, field tape, flags, snow probe
Total density, density of conifers
Avg height (clinometer), snow depth
DRAW THE TREE DIAGRAM
I took 6 10x10m transects in the sub-alpine forest. One site had aspen trees in it as well, the others were either primarily lodgepole or lodgepole and spruce-fir (I did not measure the spruce-fir trees). To find the density, I simply counted the number of conifer trees within the 100 m2 area, and calculated the average number of trees per meter (it was less than 1) Using the clinometer, I found the angle to the top of the tree, the bottom of the tree, and to the bare-trunk/foliage line. Used a 1 m snow probe to find an average snow depth for the transect
6. First page: height of trees increases with elevation, but height of bare trunk remains fairly constant. Average density increases (generally) with elevation
First page: height of trees increases with elevation, but height of bare trunk remains fairly constant. Average density increases (generally) with elevation
7. 2nd page: This is a master plot of the height of a tree compared to the percentage of the tree that is bare. The points were grouped into the sites according to elevation (site 1-lowest, site 6-highest), to see if there is a substantial shift in the regression lines as the elevation increases.
2nd page: This is a master plot of the height of a tree compared to the percentage of the tree that is bare. The points were grouped into the sites according to elevation (site 1-lowest, site 6-highest), to see if there is a substantial shift in the regression lines as the elevation increases.
8. P-value = 0.0128 3rd page: this is a plot of the density of each site compared to the percentage of the tree that is bare. As noted, the percent of the tree that is without needles increases as the density increases. This would make sense�if there are more trees in a given area, then less sunlight will reach the lower part of the forest, meaning that the height at which the tree will support photoorganelles increases.
The table in the lower left corner is the p-values for the previous graph (of tree height vs % of bare trunk). The ones that are highlighted are sites whose regressions have statistical significance.
3rd page: this is a plot of the density of each site compared to the percentage of the tree that is bare. As noted, the percent of the tree that is without needles increases as the density increases. This would make sense�if there are more trees in a given area, then less sunlight will reach the lower part of the forest, meaning that the height at which the tree will support photoorganelles increases.
The table in the lower left corner is the p-values for the previous graph (of tree height vs % of bare trunk). The ones that are highlighted are sites whose regressions have statistical significance.
9. Conclusions Total L.P. Pine height increases with elevation
Bare trunk height is variable�other factors
Density increases with elevation
% of bare trunk increases with increase in total height
No significant results�other variables are affecting the outcome
Although the relationships listed above are valid, my data is not significant enough to provide solid backing. There are other factors that influence the amount of sunlight reaching the bottom of the forest.
Although the relationships listed above are valid, my data is not significant enough to provide solid backing. There are other factors that influence the amount of sunlight reaching the bottom of the forest.
10. Other variables to consider Slope of transect
Aspect of transect (tried to keep this constant)
Elevation
Type of forest (are there deciduous trees)
Amount of exposure (wind
Snow depth (how does this affect height of bare tree)
Inaccuracies with measurements (10 m distance of transect, from tree, density average)
Slope and aspect obviously influence the amount of radiation hitting a surface.
The type of forest could play a factor: site 1 had a very high total density, but a much lower LP Pine density�the predominant species in the area was Aspen, not LP
One question for further study: how does a changing snow height influence the % of bare trunk? If there�s consistently a lot of snow in an area, maybe the bare/needle line on the trees will move up.
With different slopes, it was difficult to ensure that I was 10 m away from every tree I measured, as well as other possible human errors
11. Suggestions for next time Bring an altimeter, measure elevation
More accurate measurments of snow depth
Find a better way to measure density
Choose transects carefully, controlling for:
Slope, aspect, exposure, types of trees (no deciduous)
Finally, for next time: BRING A CAMERA More accurately measure elevation, to plot it and tree heights/bare heights on a scatter plot (put some solid numbers on the elevation)
More measurements of snow depth�instead of taking an average for the whole transect, measure each snow depth for each tree individually
My density measurements were, in my opinion, not completely reflective of the actual density of the forest. Within my 10 m transect, more often than not, there was a clearing in a significant part. Each of my density calculations are underestimations of the real density. Having a smaller transect area may also help to make these more accurate
Finally, other external variables in this experiment need to be controlled, which can be done by picking similar sites to transect (at different elevations, of course)
More accurately measure elevation, to plot it and tree heights/bare heights on a scatter plot (put some solid numbers on the elevation)
More measurements of snow depth�instead of taking an average for the whole transect, measure each snow depth for each tree individually
My density measurements were, in my opinion, not completely reflective of the actual density of the forest. Within my 10 m transect, more often than not, there was a clearing in a significant part. Each of my density calculations are underestimations of the real density. Having a smaller transect area may also help to make these more accurate
Finally, other external variables in this experiment need to be controlled, which can be done by picking similar sites to transect (at different elevations, of course)
12. Works Cited Reference articles
Arno, Steven F. Timberline: Mountain and Arctic Forest Frontiers. Chp.1 excerpt, prepared by CU. New York, 2007.
Pictures:
http://www.daviddarling.info/images/vegetation_flagging.gif
http://www2.swgc.mun.ca/botany/burntisland/images/Flagging%201.jpg