Download
1 / 16

E N D
2. Topographic Maps A map drawn with distances to scale
Also includes information about the earth�s surface
This information includes
Relief (land elevation)
Natural features
Man-made features
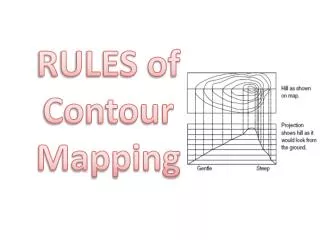
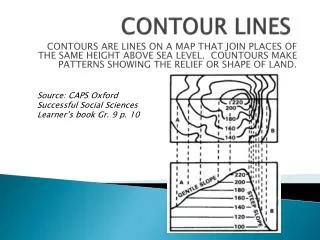
3. Topographic Maps The relief is described using lines of constant elevation called contour lines
The contour lines produce a three-dimensional map on a two-dimensional surface
4. Map Symbols Used to represent different man-made and natural features.
Give the location and an estimate of the size of the feature.
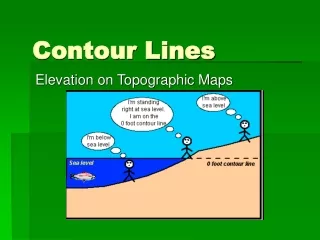
5. Contour Lines Used to show relief of the earth�s surface.
An imaginary line that connects points of equal elevation.
Before contour lines are drawn a crew must record the location and elevation of numerous points for the area to be surveyed.
6. Contour Lines Characteristics
Are continuous
Some close but others will not close depending on contour and map scale.
Are relatively parallel unless:
They meet at a cliff
They overlap at a cave overhang.
A V shape indicates a valley and the V�s point to higher elevation.
7. Contour Lines Characteristics continued
U shape indicates a ridge the U will point to lower elevation.
Evenly spaced lines indicate area of uniform slope.
Closed contours with increasing elevation indicate a hill.
The distance between contour lines indicates steepness of slope.
8. Collecting Information Stations
Determining the number of stations.
Each station requires three items of information to be measured. Two for location and one for elevation.
The scale and provision of the map help determine the number of stations.
9. Collecting Information Instrument site
The ideal site allows the instrument to see all of the site stations including:
All corners of the site
Stations required to define topography
Stations required to locate features
10. Collecting Information Control point
Similar to a turning point
Is a station that is used for more than one instrument set-up.
Notes as turning points
11. Mapping Procedure Step 1
The area to be mapped should be laid out in a grid pattern.
Establish an East-West line and a North-South baseline.
12. Mapping Procedure Step 2
Starting at the corner of the E-W line and N-S baseline measure out even intervals (10�, 50�, 100�, etc.) Drive tall stakes at each interval.
13. Mapping Procedure Step 3
Drive one more line of stakes the same interval distance from each baseline.
From these points the rodman can sight-in his position from any grid point by aligning the appropriate pair of stakes.
14. Mapping Procedure Step 4
Set-up instrument where entire grid can be sighted through the scope.
Step 5
Take a backsight on a benchmark.
If no known elevation is available choose a permanent object and assign an arbitrary elevation of 100�.
15. Mapping Procedure Step 6
Now determine each grid points elevation.
Points are identified by letters East to West and numbers North to South.
16. Mapping Procedure Step 7
To draw the map
Reproduce the grid on graph paper using an engineers scale.
Note the elevation of each grid point on the map.
Contour lines are given in even number values so the lines are determined by interpolation between adjacent grid points.