Download
1 / 58
610 likes | 827 Views
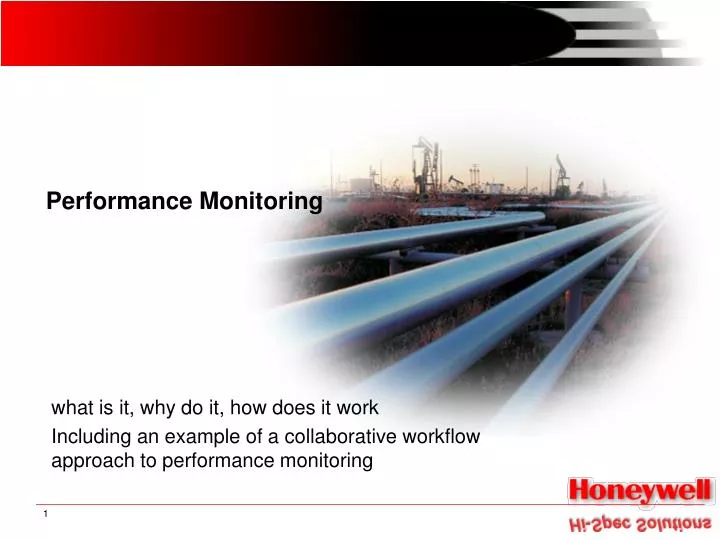
Performance Monitoring. what is it, why do it, how does it work Including an example of a collaborative workflow approach to performance monitoring. The Six Sigma Process. Decision Support Model. Info. Notifications. Workflow. Plant. Measure. Monitoring Layer (Scouts, +).

E N D
Performance Monitoring what is it, why do it, how does it work Including an example of a collaborative workflow approach to performance monitoring 1
Decision Support Model Info Notifications Workflow Plant Measure Monitoring Layer (Scouts, +) Detect Deviations Aggregate Orient Op Mode / Op Context Set Expectation C Decision UI Decision Support Layer (Alert Mgr) S Assess Impact Decide Action Diagnosis, Prognosis Decide I F A Action Layer (ERP, DCS, CMMS) Act Plan & Schedule Execute Confirm, or iterate Close out, update
Core Process Plant The breakthrough is the technology that enables the situations management process to be productive In the past…. • The situations management process has had very limited productivity. • It lacked the enabling technology to conduct the role of equipment in productive capacity. Information & access Monitor & alert Resolve Isolate faults Verify, assess & learn Assess consequences Action CMMS = computerized maintenance management system Process change Decisions for action CMMS
Collaborative Manufacturing See www.cpfr.org for more 5
Collaborative Business Model - HPI Develop Front-end Agreement Distributor or Distribution Business Development Activities Manufacture / Manufacturing Business Development Activities Planning Create Joint Business Plan Create Sales Forecast Manufacture Exception Triggers Distribution Exception Triggers Identify Exceptions for Sales Forecast Exception Criteria Exception Criteria Exception Items Distribution Decision Manufacture Decision Resolve / Collaborate On Exception items Support Data Support Data POS Data Crude and Production Planning Create Order Forecast Forecasting Order Forecast Frozen Forecast Constraints Distribution Exception Triggers Identify Exceptions For Order Forecast Manufacture Exception Triggers Manufacture Decision Distribution Decision Resolve / Collaborate On Exception Items Support Data Support Data Consumer Long Term Unresolved Supply Constraints Short Term Produce Products C-Store Order Generation Order / PO Product Blending / Shipment Execution Replenishment Terminals Delivery Execution Order Filling Feedback
Step 1: Develop Front-End Agreement • Purpose • Distributor and Refiner establish the guidelines and rules for the relationship • Addresses each party’s expectations and the actions/resources necessary for success • Includes the overall understanding and objective of the collaboration and the empowerment of resources (both actions and commitment) to be employed throughout • Output • A published agreement that provides a blueprint for beginning the collaborative, defines the process in practical terms • It also identifies the roles of each trading partner and how the performance of each will be measured • It spells out the readiness of each organization and the opportunities available to maximize the benefits from their relationship • It documents the commitment to pursuing a higher level of performance and willingness to exchange knowledge and share in the risk • Process and Data Inputs • This step asks the partners for several key inputs which, taken together, comprise the framework within which the forecast will be managed
Step 1: Develop Front-End Agreement Develop CPFR Agreement & Statement Define Service and Ordering Commitments I VI Determine Resource Involvement and Commitment Determine CPFR Goals & Objectives II VII Discuss Competencies, Resources & Systems Determine how to resolve CPFR Disagreements VIII III Define collaboration points & Responsible Business Functions Determine review cycle for The CPFR agreement IV IX Determine Information Sharing Needs Publish Front End Agreement V X Distributor Activities Either / Joint Activities Refiner Activities
Step 2: Create Joint Business Plan • Purpose • Partners exchange information about their corporate strategies and business plans in order to collaborate on developing a joint business plan • The partners first create a partnership strategy and then define category roles, objectives, and tactics • The product management profiles (e.g., Inventory replenishment levels, shipment sizes, lead times, order intervals) for products to be collaborated on are established • This improves the overall quality of forecasting by including data from both parties and facilitates communication and coordination across the supply chain • Output • A mutually agreed-on joint business plan that clearly identifies the roles, strategies, and tactics for the items to be collaborated on • This is the cornerstone of the forecasting process greatly reducing exceptions and the need for overly excessive collaboration • Process and Data Inputs • This step asks the partners to agree on strategies and tactics relative to the replenishment items
Step 2: Create Joint Business Plan Identify Corporate Strategies Identify Corporate Strategies I I Develop Partnership Strategy I Develop Category Roles, Objectives, Goals II Develop Joint Category Strategies / Tactics Develop Business Plans Develop Business Plans III V V Develop Inventory Management Profile IV Agree Joint Business Plan VI Distributor Activities Either / Joint Activities Refiner Activities
Step 3: Create Sales Forecast • Purpose • In this step, retailer point of sale (POS) data, causal information, and information on planned events are used to create a sales forecast that supports the joint business plan. In different scenarios step is carried out by the distributor or the manufacturer. • Output • A sales forecast is initially generated by one party, communicated to the other party, and then used as a baseline for the creation of an order forecast. • Process and Data Inputs • …
Step 3: Create Sales Forecast Analyze Current Joint Business Plan I Analyze Causal Information Collect & Analyze Point of Sale Data II III Identify Planned Events: Store Openings / Closings Holidays Promotions / Ads New Products / Changes Identify Planned Events: Promotions/Ads New Products/Changes Maintenance IV IV Gather Exception Resolution Data (Output of Collaboration) Generate Sales Forecast VI V Distributor Activities Either / Joint Activities Refiner Activities
Step 4: Identify Exceptions for Sales Forecast • Purpose • This step identifies the items that fall outside the sales forecast constraints set jointly by the manufacturer and distributor. • (The exception criteria for each item is agreed to in the front-end agreement.) • Output • The output from this step is a list of exception items. This information is necessary for Step 5. • Process and Data Inputs • …
Step 4: Identify Exceptions for Sales Forecast Retrieve Exception Criteria Established by Front end Agreement Retrieve Sales Forecast I Identify Refinery Changes / Updates Identify Distributor Changes / Updates II II Compare Order Forecast to Supply / Capacity III Item value outside of Limits set by exception Criteria value Determine Impact on Shipment Forecast and Apply Constraints III Yes No IV Item Identified as An Exception Data V Item Identified as NOT An Exception Data VI Distributor Activities Either / Joint Activities Refiner Activities
Step 5: Resolve/Collaborate on Exception Items • Purpose • Resolving sales forecast exceptions by querying shared data, email, telephone conversations, meetings, and so on • Submitting any resulting changes to the sales forecast • Output • Collaborative negotiations between the Distributor and the Refiner resolve item exceptions and adjust forecast • The increased real-time collaboration fosters effective joint decision and increases confidence in the eventual committed order. • Process and Data Inputs • This step begins with the exception items identified in Step 4
Step 5: Resolve/Collaborate on Exception Items Item Identified as an Exception Item Retrieve Exception Items and Decision Support Data I Research exceptions using Event Calendar & Supporting Information Select Desired Exception Criteria / Values Research exceptions using Event Calendar & Supporting Information III II III Does Research Yield Forecast Changes / Resolve Exception Does Research Yield Forecast Changes / Resolve Exception No Heighten Collaboration No IV IV IV Yes Yes Submit Changes to Sales Forecast V Distributor Activities Either / Joint Activities Refiner Activities
Step 5: Resolve/Collaborate on Exception Items Alerts & Notification (Equilon ESP) KPI Exceptions (Conoco BM) Supply Chain Modeling SAND Production Planner Collaborative Forecasting Uniformance.NET Collaborative Forecasting Item Identified as an Exception Item Retrieve Exception Items and Decision Support Data I I Research exceptions using Event Calendar & Supporting Information Select Desired Exception Criteria / Values Research exceptions using Event Calendar & Supporting Information III II III III II III Does Research Yield Forecast Changes / Resolve Exception Does Research Yield Forecast Changes / Resolve Exception No Heighten Collaboration No IV IV IV IV IV IV Yes Yes Submit Changes to Sales Forecast V V Distributor Activities Either / Joint Activities Refiner Activities
Step 6: Create Order Forecast • Purpose • Combine POS data, causal information, and inventory strategies to generate a specific order forecast that supports the shared sales forecast and the joint business plan • Actual volume numbers are time-phased and reflect inventory objectives by product and receiving location • The short-term portion of the forecast is used for order generation, while the longer-term portion is used for planning • Output • A time-phased, netted order forecast that allows the refiner to allocate production capacity against demand, while minimizing safety stock • Gives the distributor increased confidence that orders will be delivered by reducing the uncertainty between trading partners • Inventory levels are decreased, and customer service responsiveness is increased. • A platform for continual improvement among the trading partners is established. • Process and Data Inputs • …
Step 6: Create Order Forecast Analyze / Provide Refinery historical Demand & shipments Provide Sales Forecast I VI Analyze / Provide capacity limitations Provide POS data II VII Retrieve additional product Management data (frozen Period, lead time, Logistics data Provide order forecast Impact events III VIII Provide inventory strategies / seasonality's Gather order filling/ Shipment execution data IV IX Gather Exception Resolution Data (Output of collaboration) Provide current inventory Position: on hand, on order In transit Create Order Forecast X V XI Distributor Activities Either / Joint Activities Refiner Activities
Step 7: Identify Exceptions for Order Forecast • Purpose • This step determines what items fall outside the order forecast constraints set jointly by the manufacturer and distributor. • Output • The result is a list of exception items identified based on the predetermined criteria established in the front-end agreement. • Process and Data Inputs • …
Step 7: Identify Exceptions for Order Forecast Retrieve Exception Criteria Established by Front end Agreement Create Order Forecast I Identify Refinery Changes / Updates Identify Distributor Changes / Updates II II Compare Order Forecast to Supply / Capacity III Item value outside of Limits set by exception Criteria value Determine Impact on Shipment Forecast and Apply Constraints III Yes No IV Item Identified as An Exception Data V Item Identified as NOT An Exception Data VI Distributor Activities Either / Joint Activities Refiner Activities
Step 8: Resolve/Collaborate on Exception Items • Purpose • This step involves the process of investigating order forecast exceptions through querying of shared data, email, telephone conversations, meetings, and so on and submitting any resulting changes to the order forecast. • Output • The results of this step are the output of the negotiation (if necessary) between retailer and manufacturer and resolution of item exceptions, which are then submitted as an adjusted forecast. The increased real-time collaboration enabled by CPFR facilitates effective joint decision-making and fosters confidence in the order that is eventually committed. • Process and Data Inputs • This step uses the exception item data generated by Step 7.
Step 8: Resolve/Collaborate on Exception Items Item identified as an Exception item Retrieve Exception Items & Decision Support data I Research exceptions Using Event Calendar & Supporting Information Research exceptions Using Event Calendar & Supporting Information Select desired Exception criteria / values II III III Does Research yield Forecast changes/ Resolve exceptions Does Research yield Forecast changes/ Resolve exceptions Heighten Collaboration (e.g. Messaging, Phone Call, Meeting) No No V Yes IV IV Yes Submit Changes to Order Forecast VI Distributor Activities Either / Joint Activities Refiner Activities
Step 9: Order Generation • Purpose • This last step marks the transformation of the order forecast into a committed order • Order generation can be handled by either the manufacturer or distributor depending on competencies, systems, and resources • Regardless of who completes this task, the created order is expected to consume the forecast • Output • The result is a committed order generated directly from the frozen period of the order forecast • An order acknowledgment is sent as a result of the order. • Process and Data Inputs • …
Step 9: Order Generation Extract Frozen Forecast Based on Time Fence I Deploy Frozen Forecast To Order Generation II Create Order III Transmit Order Acknowledgement IV Distributor Activities Either / Joint Activities Refiner Activities
Honeywell Solution Footprint Refinery Sched. Optimization Source Make Distribute Consume Supply Chain Optimization Supply Chain Modeling & Simulation Raw Material Planning Capacity Planning Collaborative Forecasting SAND Inventory Targeting ATP / CTP / PTP Indicates partner Solution CROSS Production Planner Distribution Planning ASSAY Terminal Automation Indicates Joint Development Pipeline Modeling Blend Scheduling Gas Lift Opt. Blend Optimization Pipeline Opt. Comp. Opt. Production Analyst Pipeline Opt. Quality Mgt. Indicates Hi-Spec Solution Production Balance Production Tracker Multi-site Optimization Real-Time Optimization Asset Management & Decision Support ABC / Alerts & Notifications / POS Hi-Spec Uniformance & .NET eBusiness Infrastructure
Organizing Principle Using Manufacturing KPIs to focus project delivery on a customer’s business goals, and organizing solutions to deliver improvements to those KPIs 28
Organizing Principle • Projects need an organizing principle to maximize the effectiveness of individual efforts. • That organizing principle should be based around a clear articulation of how our solutions provide measurable benefits to customers • Once identified, these same measurements can be used as feedback mechanisms to prioritize further investment choices
Organizing Principle Customer Business Goals Manufacturing Performance Indicators Product Selection and Testing Use Case Description Investment Proposal To Management Work breakdown and cost estimate
Typical Business Goals • Delivering products on a worldwide basis, regardless of where the order is taken and where the product is shipped • Product quality must be consistent from all manufacturing sites • Shorten time between order placement and product delivery • Quality must be repeatable and predictable, with the work performed continually adjusted to meet demand • Minimize the trade-off between productivity and agility • to enable B2B e-commerce • Deliver top-tier customer satisfaction Regardless of how the latest management fad is phrased, manufacturing remains a job of doing the boring repetitive stuff right
Six Sigma • One can derive from these business goals a clear motivation for improving quality • Delivering Six Sigma quality requires improvements in both repeatability and predictability of an operation • With improvements in repeatability, manufacturing capacity can be better utilized • No reprocessing off-spec material • With improvements in predictability, many of the lags in the manufacturing process can be removed • No waiting for the Lab to certify that product is on spec • No extended analysis required to decide whether to accept a purchase order / place a bid for work • Without the lags in the manufacturing process, inventory can be reduced, freeing up working capital
Lower level business goals • Accurate and timely KPIs • Manufacturing KPIs calculated directly as data becomes available, and variance from goals reported directly to managers of interest • Remove verbal instructions and manual reporting from the work practices • Operating orders derived electronically from the purchasing orders, and delivered directly to process operators when needed
Monitoring Manufacturing Performance • Monitor manufacturing performance using Key Performance Indicators • Primary KPIs - Consequential • Key variables that management consider to have a measurable impact on/relationship to the bottom line • Identify a problem may exist, but not where it came from • Management will set stretch goals for these KPIs • Secondary KPI’s - Causal • These KPIs help identify the where to start looking for the causes of missed targets with the primary KPIs’ • Usually require a comparison of expected (forecast) values with actual values (Plan vs Actual) • Often thought of as Production KPIs • Six Sigma methodology focuses on improving standard deviation of delta, not absolute value - I.e. Improve accuracy of forecasting and operation • Tertiary KPIs - Controllable • These KPIs track the fundamentals of the forecasting • Often thought of as Process KPIs, and tend to be quite large in number • Usually at the individual property level or control variable level • Compare forecast vs actual with historical expectations
Monitoring Manufacturing Performance • Primary KPIs for Batch Processes • # of Batches run in a week • # of Batches requiring rework in a week • % Reactor Utilization Rate • % Batch rework per reactor • # Cycle time variance exceptions • Total inventory of work in progress • Lab utilization rate • Ranking of day relative to previous days
Monitoring Manufacturing Performance • Calculating Primary KPIs for Batch Processes • # of Batches run • When a batch starts, increment global batch counter • A calculation tag calculates delta change during period (24 hrs) • # of Batches requiring rework • When a batch requires rework, increment global batch rework counter • A calculation tag calculates delta change during period (24 hrs) • % Batch rework • calculation tag calculates 100*(delta batch count - delta rework count) / (delta batch count) • % Reactor Utilization Rate • When a batch starts on a reactor, set reactor in use flag to true • When a batch ends on a reactor, set reactor in use flag to false • A calculation tag calculates percent in use during period (24 hrs) • A calculation tag calculates Sum (%ReactorUtilization) during period
Monitoring Manufacturing Performance • Calculating Primary KPIs for Batch Processes • # Cycle time variance exceptions • When a cycle time is outside variance limits, increment a cycle time exception counter • A calculation tag calculates delta exception count during period (24 hrs) • % Batch rework per reactor • When a batch starts, increment reactor batch counter • When a batch requires rework, increment reactor batch rework counter • calculation tag calculates (delta batch count - delta rework count) /100 • Total inventory of work in progress • Sum of all tank inventory in tanks + sum of all transfers into reactors
Monitoring Manufacturing Performance • Calculating Primary KPIs for Batch Processes • Lab utilization rate • When a certification starts, increment global lab counter • calculation tag calculates delta lab counter for period (1 hr) • Ranking of day relative to previous days • calculation tag calculates unified KPI = A*#Batches + B*#Reworks + C*Sum(%ReactorUtil) + D*WorkInProgress • Excel spreadsheet function calculates Percentage(UnifiedKPI) which ranks the last 24 hr period versus comparable periods
Monitoring Manufacturing Performance • Secondary KPIs for Batch Processes • Batch yield versus standard • Batch cycle time versus standard • Reaction cycle time versus standard • Certification cycle time versus standard • Cool-down cycle time versus standard • Pump-out cycle time versus standard • Raw material consumption vs recipe • Lab utilization rate forecast (requires scheduling tool) • Reactor utilization rate forecast (requires scheduling tool) • Schedule slippage (Batch start time vs Plan start time)
Monitoring Manufacturing Performance • Tertiary Batch Performance Monitors • Individual transfer quantity balance, source vs destination • Recipe phase cycle time • Finished batch property vs specification limits • Finished batch property vs SQC limits • Finished batch property vs PCA/PLS forecast
Monitoring Manufacturing Performance • Primary KPIs for receiving and shipping • % Order satisfied on time • % Order satisfied on quantity • % Orders shipped with optimal transportation • % Orders with safety compliance exceptions • % Orders incurring demurrage • $ Demurrage costs incurred • Loading area utilization rate • Unloading area utilization rate • Ranking of day relative to previous days operation • Month to date ranking relative to previous operation
Monitoring Manufacturing Performance • Calculating primary KPIs for receiving and shipping • % Order satisfied on time • When an order begins, increment an order counter • When an order slippage variance is detected, increment slippage variance counter • calculation tag calculates 100*(delta order counter - delta slippage counter) / (delta order counter) for a given period • % Order satisfied on quantity • When an order quantity variance is detected, increment quantity variance counter • calculation tag calculates 100*(delta order counter - delta quantity counter) / (delta order counter) for a given period • % Orders shipped with optimal transportation • When sub-optimal transportation is detected, increment transportation variance counter • calculation tag calculates 100*(delta order counter - delta transportation counter) / (delta order counter) for a given period
Monitoring Manufacturing Performance • Calculating primary KPIs for receiving and shipping • % Orders with safety compliance exceptions • When a safety compliance exception is detected, increment safety exception counter • calculation tag calculates 100*(delta order counter - delta safety counter) / (delta order counter) for a given period • % Orders incurring demurrage • When demurrage incident is detected, increment demurrage counter • calculation tag calculates 100*(delta order counter - delta demurrage counter) / (delta order counter) for a given period • $ Demurrage costs incurred • When demurrage incident is detected, calculate the demurrage cost for this increment (cycle time - free time) * demurrage rate and add this to a demurrage counter • calculation tag calculates delta demurrage counter for a given period e.g. $/day
Monitoring Manufacturing Performance • Calculating primary KPIs for receiving and shipping • Loading area utilization rate • When a product receipt begins, set the Equipment In Use flag to True. When the receipt ends, set the Equipment In Use flag to False. • calculation tag calculates percent in use for a given period e.g. 24 hr • Unloading area utilization rate • When a product shipment begins, set the Equipment In Use flag to True. When the receipt ends, set the Equipment In Use flag to False. • calculation tag calculates percent in use for a given period e.g. 24 hr • Ranking of day relative to previous days operation • calculation tag calculates Shipment unified KPI = A*#Shipments + B*$ShipDemurrage+C*Avg(%SEquipUtil)+D*WorkInProgress • Excel spreadsheet function “Percentage(ShipUnifiedKPI)” which ranks the last 24 hr period versus comparable periods • calculation tag calculates Receipt unified KPI = A*#Receipts + B*$RecDemurrage+ C*Avg(%SEquipUtil) +D*WorkInProgress • Excel spreadsheet function “Percentage(RecUnifiedKPI)” which ranks the last 24 hr period versus comparable periods
Monitoring Manufacturing Performance • Secondary level KPIs for shipping and receiving • Order placement to delivery cycle time • Time of vehicle/vessel on site • Demurrage is time spent in excess of free-time • Safety compliance reports (by order, by vessel and by supplier) • Certification cycle time • Plan vs actual order quantity • Vehicle/vessel preparation cycle time • Pumping cycle time • Individual transfer quantity balance, source vs destination • Vehicle/vessel check-out cycle time