Download
1 / 20
200 likes | 225 Views
Explore principles, methods, and mitigation measures of visual impact assessment for coastal wind projects. Learn about visual perception, assessment techniques, and simulation production.

E N D
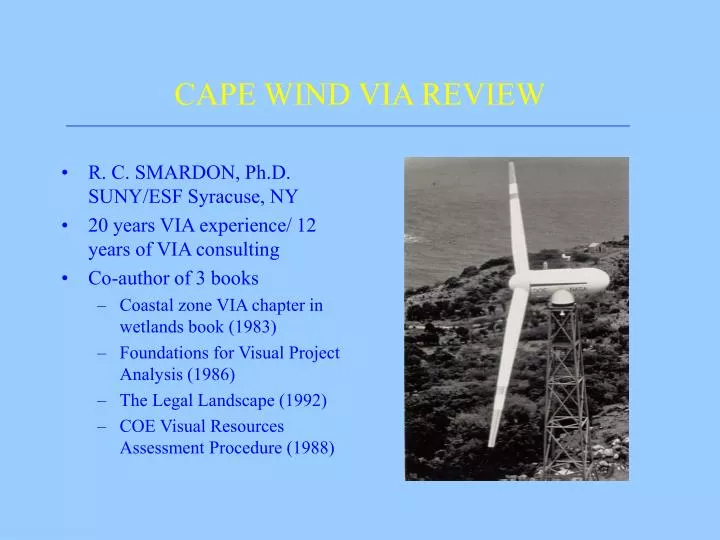
CAPE WIND VIA REVIEW • R. C. SMARDON, Ph.D. SUNY/ESF Syracuse, NY • 20 years VIA experience/ 12 years of VIA consulting • Co-author of 3 books • Coastal zone VIA chapter in wetlands book (1983) • Foundations for Visual Project Analysis (1986) • The Legal Landscape (1992) • COE Visual Resources Assessment Procedure (1988)
CAPE WIND VIA REVIEWOutline of presentation • Visual perception in the Coastal Zone landscape • Existing VIA methods/criteria • 8 step VIA process • The coastal landscape • Viewer sensitivity • Visibility assessment • Key viewpoint determination • Impacting activity character • Simulation production • Visual Assessment • Mitigation measures
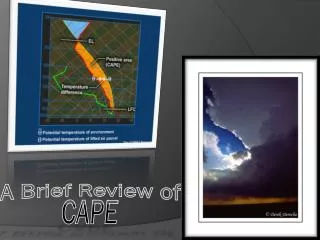
CAPE WIND VIA REVIEWPrinciples of visual perception Visual perception Due to : Directional Radiation (sun)> Atmospheric Scattering > Diffuse Illumination> Scatter reflection On earth’s surface Source: Foundations for Visual Project Analysis (1986)
CAPE WIND VIA REVIEWPrinciples of visual perception Foveal vision set: 50 degrees above the horizon line 70 degrees below the horizon 30 degrees of easy eye movement Source: Foundations for Visual Project Review (1986) Smardon et al. Both bright and dark objects have the same distance recognition function at the horizon line. Source: USEPA, Protecting Visibility (1979)
CAPE WIND VIA REVIEWVisual Impact Assessment Methods/Criteria • BLM contrasting rating system • Source: USDI, BLM 1980 • US Forest Service visual absorption capability • Wagstaff & Brady 1982 • US Corps of Engineers VRAP- composition & dominance • Smardon et al. 1988 • Scenic beauty - • Daniel & Boster 1976 • Like/dislike, novelty, tidiness, complexity, dominance, reliability - Thayer & Freeman 1987 General Source: Foundations for Visual Project Analysis. 1986 Smardon et al.
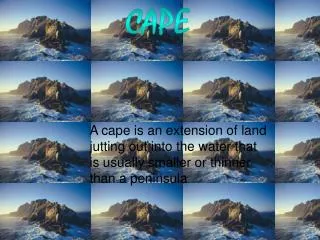
CAPE WIND VIA REVIEW1. Coastal Landscape Characterization • Type of view: • open water • panoramic edge • filtered • Atmospheric effects • clear, fog or haze • Water edge land use • developed or undeveloped • Water & wave affects • Sources:Mann 1979, Nausauer & Benner 1984, Smardon & Hunter 1983, Smardon and Felleman 1982
CAPE WIND VIA REVIEW2. Landscape Viewer Sensitivity • Catalog and map landscape users, activity patterns and critical periods of use: • Beach/shoreline activities • Traffic and highway views • Recreational boating activity • Commercial ferry boat routes • Source: Smardon & Hunter 1983
CAPE WIND VIA REVIEW3. Visibility Assessment • Determine distance zones appropriate to coastal area • Key threshold is middle ground to back ground at 3.5 miles • Mediating atmospheric effects such as fog or haze blur contrast over distance • Also account for front lighting, back lighting or seasonal affects • Sources: Foundations for Visual Project Analysis 1986 and USEPA Protecting Visibility 1979
CAPE WIND VIA REVIEW3. Visibility Analysis Normal visual range is between 15 -25 miles on the Cape except summer when it is less than 15 miles. Source: USEPA Protecting Visibility 1979
CAPE WIND VIA REVIEW3. Visibility Assessment • Open water tends to cause potential reduction of apparent height of objects at distance • Due to wave height • Curvature of the earth • Sources: • Mann 1979 • Smardon & Hunter 1983
CAPE WIND VIA REVIEW3. Visibility Assessment Map visibility and distance zones reflecting user activity and line-of-sight views. Source: Smardon & Hunter 1983
CAPE WIND VIA REVIEW4. Key Viewpoint Determination Using visibility and use activity patterns/density - locate key viewpoints for simulations. Source: Smardon & Hunter 1983
CAPE WIND VIA REVIEW5. Impacting Activity Characterization • Individual wind turbines • Tower/blade dimensions • Color/texture • Group arrangement • Night lighting • Alternatives for all of above • Sources: • Engstom and Pershagon 1980 • Ferber 1977 • Thayer & Freeman 1987 • Wagstaff & Brady 1982
CAPE WIND VIA REVIEW6. Simulation Production • Document angle of lens used • Distance to object • Aspect or angle of viewer • Lighting & weather conditions including haze, fog, etc. • Location of viewpoint where picture was taken including reference points or GPS • Assumptions regarding all of above • Key references:Sheppard 1989, Baird et al. 1979, Gillespie and Clark 1979
CAPE WIND VIA REVIEW6. Simulation Production Take into account all previous physical factors in production of Visual simulations. From Smardon & Hunter 1983
CAPE WIND VIA REVIEW7. Assessing Visual Impacts • Utilizing key points, simulations & alternatives - use established criteria consistently: • Visual/scenic quality • Visual contrast • Visual complexity, etc. • Sources: • Foundations for Visual Project Analysis. 1986. Smardon et al. • The Legal Landscape. 1992. Smardon and Karp Cross Lake case study: next 2 slides
CAPE WIND VIA REVIEW7. Simulating & Assessing Visual Impacts Cross Lake: Simulation. Note light/shadow + water texture Cross Lake: Before image
CAPE WIND VIA REVIEW7. Simulating & Assessing Visual Impact existing Alternative 1 Alternative 1 Alternative 2 Side by side comparison yields different impacts: Source; Smardon & Karp 1992
CAPE WIND VIA REVIEW7.Night lighting issues/simulation/assessment • Determine FAA standards: • Medium intensity flashing white • High intensity flashing white • Dual lighting; red and white • Calculate foot candles emitted • Determine atmospheric conditions,e.g. clear or foggy • Do night lighting simulations • Assess impact/glare > amount of new light emitted • Sources: USDOT,FAA 2000, Blair et al. 1980 & 1982
CAPE WIND VIA REVIEW8. Mitigation measures • Contrast reduction • Height/size reduction • Turbine density/group configuration • Distance from shore • Turbine structure color/value • Night lighting impact reduction • Interpretive sites • Key Sources:Engstom & Pershagon 1980, Ferber 1977, Thayer & Freeman 1987, Wagstaff & Brady et al 1982, Therkelson et al 1980