Download
1 / 24
1.07k likes | 3.81k Views
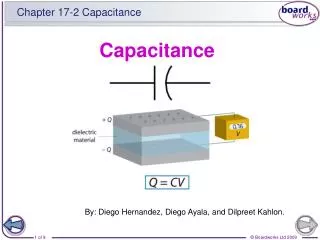
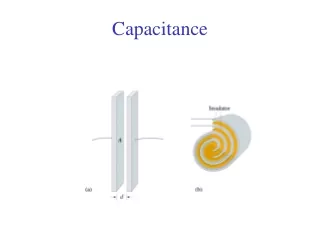
Electrochemical capacitance-voltage and Photovoltage spectroscopy. 광전자재료협동과정 오창원. CONTENT. A principle of C-V measurement Electrochemical C-V profiler How ECV works Parameters of C-V measurment Advantages and disadvantages Overview of Photovoltage spectroscopy.

E N D
Electrochemical capacitance-voltage and Photovoltage spectroscopy 광전자재료협동과정 오창원
CONTENT • A principle of C-V measurement • Electrochemical C-V profiler • How ECV works • Parameters of C-V measurment • Advantages and disadvantages • Overview of Photovoltage spectroscopy
Ideal MOS( metal-oxide-semiconductor capacitor ) structure • Gate는 충분히 두꺼워서 bias를 가해도 등전위 영역으로 간주된다. • Oxide는 bias를 가해도 전류가 흐르지 않는 perfect insulator이다. • Oxide내에서나 oxide-semiconductor 계면에서 charge center는 없다. • 반도체는 uniform doping 되어 있다. • 반도체는 충분히 두꺼워서 gate potential을 가하든지 아니든지 bulk는 field-free영역이다. • 반도체와 금속 사이에는 ohmic contact이다. • MOS-C의 변수들은 x에 의해서 변하는 1차원적인 구조이다 • FM = c + ( EC – EF )∞
Equilibrium energy band diagram Semiconductor Metal Oxide
Effect of applied bias (n-type semiconductor) Energy band diagram and block charge diagrams in ideal n-type MOS cap.
KoeoAG Cacc= Co= xo koeoAG KseoAG Co= Cs= xo W Co CoCs Cdep= = Co+ Cs Ko W 1 + Ksxo Capacitance-voltage characteristics (a) Accumulation (b) Depletion (c) Inversion when ω → 0 (~10Hz) Cinv = Co (d) Inversion when ω → ∞ (~1MHz) Cinv = Cdep
C/Cox 1 high temp. low temp. VT Co 0 CoCs VG Cdep= = Co+ Cs Ko W 1 + Ksxo Influences on the C-V curve Oxide의 두께 Doping level Temprature 변화 VG = fs + es/eoxxox√(2qNA/es)fs
Non-ideal MOS capacitor Nonideal device에서 flat band로 만들어 주기 위해서 bias를 가해줌 Al 이 gate 일 때, Fm = 4.1 eV p-type Si 가 반도체일 때, Fs = 4.9 eV 금속에 -0.8 eV를 가해주면 금속의 fermi energy가 올라가게 되어 flat band가 되는데, 이 때 가해주는 gate bias VG를 VFB라 함 Equilibrium energy band diagram typical of real MOS structure
Metal-semiconductor work function difference Effect of a FMS ≠ 0 on the MOS-C high frequency C-V curve Barrier height different in selected metal-SiO2-Si structure
Electrochemical C-V profiler 모델 : ECVpro 제조사 : accent optical technology(英) <주요 제원> ◦ 측정물질 : II-VI, III-V (InP, GaN) compounds, and Silicon ◦ 운반자농도 측정범위 : 1013 ~1020cm-3◦ 식각깊이영역 : 0.05 ~ 50μm ◦ 최소식각정도: 1nm ◦ 시료크기 : 12x12mm ~ 지름 150mm (수동 wafer mapping 가능) ◦ 식각중 표면관찰 가능 ◦ 운반자진동수 : 0.3kHz ~ 25kHz ◦ Bias전압 : ± 10V ◦ 광원 : Mercury-Xenon lamp ◦ Blast : 40V AC
C-V로 측정할 수 있는 parameters 1. 반도체의 doping type n-type 경우 C-V curve p-type 경우 C-V curve
Co 2eS CoCs W = ( FS)1/2 Cinv= = qNA Co+ Cs Ko WT 1 + Ksxo C-V로 측정할 수 있는 parameters 2. Doping concentration C-V curve에서 accumulation에서 C값과 inversion (high frequency)에서의 C값으로부터 doping concentration을 구할 수 있다. - (2) - (1) 식 (1)에서 depletion width WT를 구해서 식 (2)으로부터 doping concentration NA를 구할 수 있다. Ex) 5um의 Si위에 950Å의 oxide층이 입혀진 경우에 Cmin/ Co=0.49가 얻어졌다면, 그림에서 a=16이 나온다. a=log10N 이므로 N =1016(cm-3)이 얻어진다.
C-V로 측정할 수 있는 parameters 3. Oxide thickness Capacitance값을 알고 eox값을 알면 Cox= eox/ tox로부터 oxide thickness를 알 수 있다. 4. Mobile charge △VG = - QM / Cox 5. Fixed charge △VFB–fms= - Qf / Cox
Advantages and disadvantages ⅰ. It is direct method of measuring the carrier concentrations. ⅱ. No sample preparation is needed except the conventional surface cleaning of the sample. ⅲ. ECV can be used in a wide range of structures and materials provided an adequate electrolyte is chosen. ⅳ. Since the electrolyte used is transparent to light of wavelength shorter than 1.2um, the optical measurement can be performed in the same chemical cell. ⅰ. The use of chemicals destroys the sample and contaminates the unetched part of the sample. ⅱ. The sealing-ring area needs careful calibration to assure reliable results.
q Fa(l)( L+ Wd) Voc = 1/ Rl + ( qIs)/ kT Photovoltage spectroscopy When light energy hn> Eg illuminates a junction (p-n, Schottky, n-n+ or p-p+) or within a diffusion length from the junction, the photogenerated electrons and holes are seperated by the junction field and create a photogenerated voltage drop across the junction. F : photon flux density a(l) : absorption coefficient at wavelengthl Wd : depletion width L : diffusion length Rl : leakafe resistance Is : reverse saturation current k : Boltzmann constant T : temperature in Kelvin