Download
1 / 19
200 likes | 433 Views
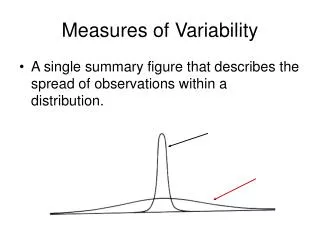
Chapter 4 Measures of Variability. 4.1 Overview. Variability can be defined several ways Purposes of Measure of Variability. Figure 4.1 Population Distributions. Three Measures of Variability. The Range The Variance The Standard Deviation. 4.2 The Range.

E N D
4.1 Overview • Variability can be defined several ways • Purposes of Measure of Variability
Three Measures of Variability • The Range • The Variance • The Standard Deviation
4.2 The Range • The distance covered by the scores in a distribution
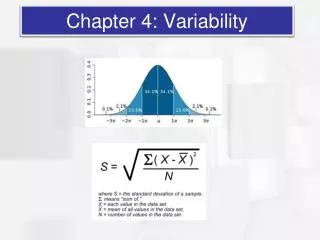
4.3 Standard Deviation and Variance for a Population • Most common and most important measureof variability is the standard deviation • A measure of the standard, or average, distance from the mean • Describes whether the scores are clustered closely around the mean or are widely scattered • Calculation differs for population and samples • Variance is a necessary companion concept to standard deviation but not the same concept
Defining the Standard Deviation • Step One: Determine the Deviation • Deviation is distance from the mean • Step Two: Find a “sum of deviations” to use as a basis of finding an “average deviation” • Two problems • Deviations sum to 0 • If sum always 0, “Average Deviation” will always be 0. • Need a new strategy! Deviation score =
Defining the Standard Deviation(continued) • Step Two Revised: Remove negative deviations • First square each deviation score • Then sum the Squared Deviations (SS) • Step Three: Average the squared deviations • Mean Squared Deviation is known as “Variance” • Variability is now measured in squared units
Defining the Standard Deviation(continued) • Step Four: • Goal: to compute a measure of the “standard” (average) distance of the scores from the mean • Variance measures the average squared distance from the mean—not quite our goal • Adjust for having squared all the differences by taking the square root of the variance
Population Variance Formula sum of squared deviationsVariance = number of scores
Two formulas for SS Definitional Formula Computational Formula • Square each score and sum the squared scores • Find the sum of scores, square it, divide by N • Subtract the second part from the first • Find each deviation score (X–μ) • Square each deviation score, (X–μ)2 • Sum up the squared deviations
Population Variance:Formula and Notation Formula Notation Variance is the average of squared deviations, so we identify population variance with a lowercase Greek letter sigma squared: σ2 Standard deviation is the square root of the variance, so we identify it with a lowercase Greek letter sigma: σ
Learning Check • Decide if each of the following statements is True or False.
4.4 Standard Deviation and Variance for a Sample • Goal of inferential statistics: • Samples differ from the population • Samples have less variability • Computing the Variance and Standard Deviation in the same way as for a population would give a biased estimate of the population values
Sample Variance andStandard Deviation • Sum of Squares (SS) is computed as before • Formula for Variance has n-1 rather than N in the denominator • Notation uses s instead of σ
Learning Check • A sample of four scores has SS = 24.What is the variance?
Variance and Inferential Statistics • Goal of inferential statistics is to detect meaningful and significant patterns in research results • Variability in the data influences how easy it is to see patterns