Download
1 / 14
200 likes | 801 Views
Measures of Variability. A single summary figure that describes the spread of observations within a distribution. Measures of Variability. Range Difference between the smallest and largest observations. Variance Mean of all squared deviations from the mean. Standard Deviation

E N D
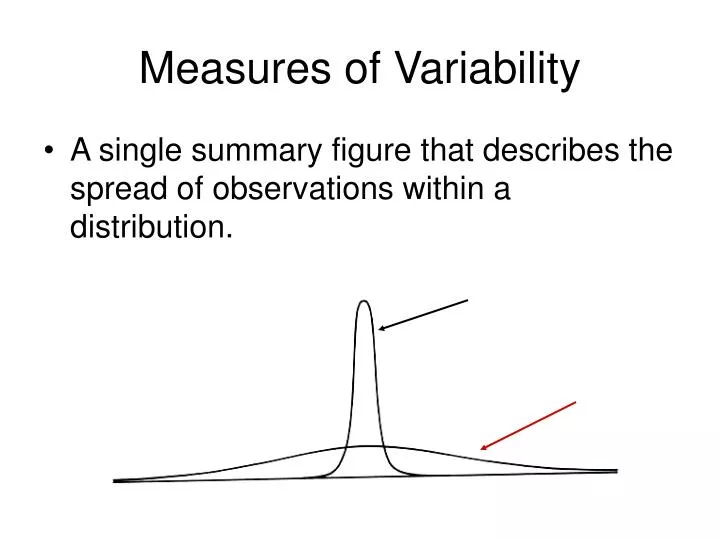
Measures of Variability • A single summary figure that describes the spread of observations within a distribution.
Measures of Variability • Range • Difference between the smallest and largest observations. • Variance • Mean of all squared deviations from the mean. • Standard Deviation • Rough measure of the average amount by which observations deviate from the mean. • The square root of the variance.
Variability Example: Range • Las Vegas Hotel Rates 52, 76, 100, 136, 186, 196, 205, 150, 257, 264, 264, 280, 282, 283, 303, 313, 317, 317, 325, 373, 384, 384, 400, 402, 417, 422, 472, 480, 643, 693, 732, 749, 750, 791, 891 • Range: 891-52 = 839 • Pros • Very easy to compute. • Scores exist in the data set. • Cons • Value depends only on two scores. • Very sensitive to outliers.
Variance • The average amount that a score deviates from the typical score. • Score – Mean = Difference Score • Average Mean Difference Score
Variance • In order to make this number not 0, square the difference scores (no negatives to cancel out the positives).
Population Sample Variance: Definitional Formula “sigma” *Note the “n-1” in the sample formula!
Variance • Use the definitional formula to calculate the variance. -1
Population Sample Variance: Computational Formula
Variance • Use the computational formula to calculate the variance.
Variability Example: Variance • Las Vegas Hotel Rates
Population Sample Standard Deviation -Rough measure of the average amount by which observations deviate on either side of the mean. -The square root of the variance. -Returns squared units to original units (more meaningful)
Variability Example: Standard Deviation Mean: 6 Standard Deviation: 2.11
Pros Lends itself to computation of other stable measures (and is a prerequisite for many of them). Average of deviations around the mean. Majority of data within one standard deviation above or below the mean. Combined with mean: Efficiently describes a distribution with just two numbers Allows comparisons between distributions with different scales Cons Influenced by extreme scores. Pros and Cons of Standard Deviation
Ch. 4 homework 16 8 23 7 31 18 12 19 15 20 28 27 9 18 49 11 14 5 18 17 3 6 25 1 • 1. Find the range, variance, and standard deviation for the sample data (# candy bars eaten) above. • 2. How would your answers in #1 change if this were a population? Why? • 3. Repeat #1 if the sample data included the 100 candy bar eater. How do these results compare to before? • 4. If everyone in the sample ate 10 more candy bars the following month, what would the range, variance, and standard deviation be?