Download
1 / 23
230 likes | 373 Views
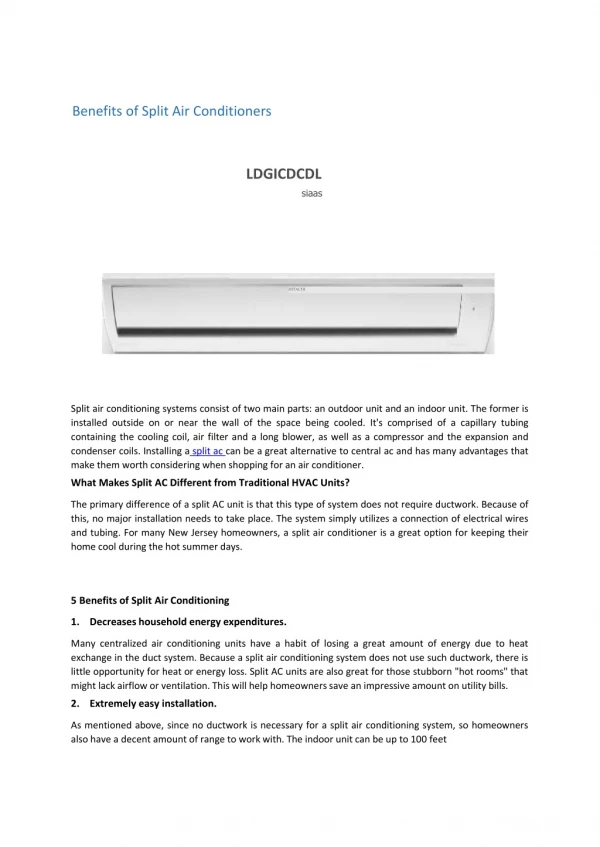
Air Emission Benefits of CHP Air Innovations Conference August 10, 2004. Joel Bluestein Energy and Environmental Analysis, Inc. Prepared under contract for EPA. Combined Heat and Power. Combined Heat and Power is the generation of electricity and heat sequentially from the same heat input

E N D
Air Emission Benefits of CHPAir Innovations ConferenceAugust 10, 2004 Joel Bluestein Energy and Environmental Analysis, Inc. Prepared under contract for EPA
Combined Heat and Power • Combined Heat and Power is the generation of electricity and heat sequentially from the same heat input • CHP is a proven strategy for increasing the efficiency for electric and thermal generation • 77 GW of existing CHP in U.S. • approximately 10% of total U.S. electric generation • Advantages • CHP is more efficient than separate generation of electricity and heat • CHP can replace older, high emitting emission sources that would otherwise not be upgraded or retired • CHP is applicable to all fuels and prime mover technologies
Typical CHP Systems Steam Boiler/Steam Turbine: Gas Turbine or Engine/Heat Recovery Unit:
Prime Mover NOx Emissions Data Sources: EEA, U.S. EPA, DOE
NOx Emissions Based on Total CHP Output Data Sources: EEA, U.S. EPA, DOE
Example Opportunities for CHP • Hospitals, universities, prisons, other “campus” facilities • Medium size industries with thermal loads • Casinos, resorts, hotels, nursing homes. • Wastewater treatment plants, biomass facilities • District energy facilities
Case Study: Hotel/Casino • 6 x 0.8 MW reciprocating gas engine with advanced emission controls • 0.28 g/bhp-hr (0.89 lb/MWh) NOx and CO • Provides electricity and hot water • 34% reduction in energy consumption • 45 tons/yr NOx reduction (79 percent) • 51 tons/yr SO2 reduction (100 percent) • 17,370 tons CO2 reduction (52 percent)
Case Study: Refinery • Gas combined cycle in Houston non-attainment area • 546 MW, 3.1 MM lb steam capacity • 40% reduction in energy consumption • 6,240 tons/yr NOx reduction (96 percent) • 6,050 tons/yr SO2 reduction (100 percent) • 2.1 MM tons/yr CO2 reduction (52 percent)
EPA CHP Partnership • Established in 2001. • To assist deployment of environmentally beneficial CHP projects. • To provide services and tools for states and industry to assist project development and market transformation. • Accomplishments to date: 2,000 MW of CHP capacity (20+ projects).
EPA CHP Partnership Services to States • Assist with market assessments, education, outreach, technical information. • Developed a handbook on permitting of CHP on an output basis: • Output-Based Regulation: A Handbook for Regulators • Available for download at www.epa.gov/cleanenergy
Wisconsin Division of Energy Minnesota State Energy Office San Diego Regional Energy Office Ohio Office Energy Efficiency Illinois Department of Commerce NYSERDA Indiana Department of Commerce Illinois Environmental Protection Agency Iowa Department of Natural Resources City of Chicago Delaware State and Local EPA CHP Partners
Current Example State Actions • NYSERDA, San Diego REO, NJ BPU pursuing CHP incentive programs. • WI - Looking at replacing cyclone boilers and promoting biomass CHP. • IL EPA and IA DNR focusing on CHP in ethanol plants. • TX - Established permitting on output basis.
For Further Information Contact: Combined Heat and Power Partnership U.S. Environmental Protection Agency Luis Troche Team Leader troche.luis@epa.gov ph: (202) 343-9442 fax: (202) 343-2208
Appendix – Additional Information on CHP Sectors, Fuels, Technology, Costs,Emissions
CHP is Well Demonstrated Industrial sites represent ~90%of existing CHP 77,100 MW at 2,719 sites in 2003 Average capacity is 28 MW Source: EEA
CHP Fuel Distribution Waste 11% Other 2% Wood/ Biomass 3% Oil 2% Coal 15% Natural Gas 68% Source: EEA
Typical CHP Technology Options Gas Turbine Steam Turbine Microturbine Reciprocating Engine Fuel Cell
Gas Turbines Lean Burn Engines Rich Burn Engines Strong Market Position Market Position Emerging Position Fuel Cells MicroTurbines 10 100 1,000 10,000 100,000 Applicable Size Range, kWe Technology vs Size Coverage
Size Efficiency Installed O&M Costs Status (%) Costs ($/kW) ($/kWh) Reciprocating Commercial 30 kW - 28 - 38 500 - 1400 0.007-0.02 Engine 6 MW Commercial Industrial Gas 500 kW - 22 - 40 600 - 1500 0.003-0.008 Turbine 20 MW Microturbines 800 - 1400 Early Entry 20 - 28 25 kW - 0.003-0.01 300 kW Fuel Cells 2000 - 8000 36 - 60+ 1996 - 2010 3kW - 0.005-0.010 3MW How do the Technologies Compare?
CHP Replacing On-Site Boiler Emissions Data Sources: EEA, U.S. EPA, DOE