Download
1 / 32
320 likes | 451 Views
The Star Formation Histories of Disk Galaxies. Knut Olsen Collaborators: Bob Blum, Andrew Stephens, Tim Davidge, Phil Massey, Steve Strom, François Rigaut, and Joss Bland-Hawthorn Science with Giant Telescopes: Public Participation in TMT and GMT Chicago, June 16, 2008.

E N D
The Star Formation Histories of Disk Galaxies Knut Olsen Collaborators: Bob Blum, Andrew Stephens, Tim Davidge, Phil Massey, Steve Strom, François Rigaut, and Joss Bland-Hawthorn Science with Giant Telescopes: Public Participation in TMT and GMT Chicago, June 16, 2008 T.A.Rector and B.A.Wolpa/NOAO/AURA/NSF
Juneau et al. (2005) Benson et al. (2007) Stockton et al. (2004) Motivation I – Many lines of evidence showing that massive galaxies form the bulk of their stars at high redshift, earlier than less massive galaxies – More massive galaxies have heavier contribution from spheroidal components, reinforcing the idea that bulges and elliptical galaxies are old, and disks are accreted later – Massive disk galaxies also exist at high redshift; may be the galaxies that form massive spheroids?
320 kpc 40 kpc Dark matter Gas Stars Motivation II – Hierarchical structure formation does an excellent job of describing large scale structure; history of build-up of dark matter, however, appears different than that of the observed stellar mass buildup – Galaxy formation is complex and non-linear, depending on processes operating on a huge range of scales – Star formation histories of simulated disks are sensitive to the input physics, e.g. feedback from stars and merging, as well as to the mass of the parent galaxy Abadi et al. (2003) The observed Universe vs. a simulated one (Springel, Frenk, & White 2006)
Robertson et al. (2004) • Feedback inhibits rapid collapse of gas • Feedback regulates star formation • Introduces dependence on galaxy mass • Also expect dependence on environment Governato et al. (2007)
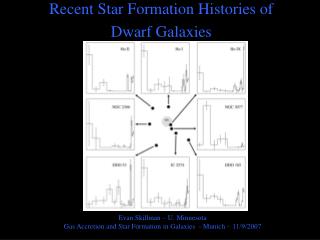
Approach Milky Way bulge from near- and mid-IR photometry (van Loon et al. 2003): old stars dominate The M31 halo with HST (Brown et al. 2007): old and intermediate-age populations A summary of Local Group dwarf star formation histories (Grebel & Gallagher 2004): variety is the rule
Why ELTs? Need a representative sample of morphological types of galaxies Need to sample orders of magnitude in the range of environmental densities Both argue for getting out to 10 Mpc and beyond With high surface brightnesses and faint sources, need to consider both sensitivity and crowding From Tully group catalog
Modeling crowding Crowding introduces photometric error through luminosity fluctuations within a single resolution element of the telescope due to the unresolved stellar sources in that element. I V
To calculate the effects of crowding on magnitudes and colors, we need only consider the Poisson statistics of the luminosity functions (e.g. Tonry & Schneider 1988) hi For magnitudes: For colors: 8 8
30-m (I and J) Crowding limits for current and future telescopes HST (optical) Gemini North 30-m (near-IR) Magnitudes at which 10% photometry is possible in regions of surface brightness SV=22, SK=19 for galaxies at the indicated distances.
Using K=22 mag arcsec-2 Using avg How big an ELT do we need? – The main sequence and its turnoff is the most fundamental indicator of stellar age and metallicity, but the stars are faint and extremely crowded – More advanced phases of stellar evolution can also be used to determine the ages and metallicities of populations of stars, at the expense of more uncertain theoretical modeling
Current Systems: the Bulge and Disk of M31 with Gemini N and NIRI+Altair • Nearby: • Can study entire star formation history from its resolved stars • Complementary to studies of galaxies with z > 0.5, which are limited to integrated broadband photometry or IFU spectroscopy • Extragalactic: • Can easily trace contributions from different galactic components • Milky Way produces important constraints on the stellar populations of galactic components, but from large and heterogeneous datasets Local Group Survey (Massey et al. 2002) image
Bulge 2: 320s J, 320s H, 1040s K 0.”11 J, 0.”085 H, 0.”09 K Disk 1: 960s J, 960s H, 3480s K 0.”11 J, 0.”09 H, 0.”10 K Bulge 1: 520s J, 480s H, 880s K 0.”15 J, 0.”09 H, 0.”09 K Disk 2: 540s H, 3420s K 0.”059 H (~30% Strehl), 0.”066 K (~40% Strehl) Observations Gemini N+Altair/NIRI SV observations, 18-19 Nov 2003 (one night photometric) Disk 2 field observed 14 Sep 2006: 0.´´2 - 0.´´3 seeing, photometric NIRI/Altair provided near diffraction-limited imaging in HK over 22.´´5 22.´´5 field We also include published HST/NICMOS data from Stephens et al. (2003)
Analysis • Usefully measure stars as faint as MK = -4 to -5 (includes TRGB) in bulge and inner disk (published in Davidge et al. (2005) and Olsen et al. (2006) ) • Disk 2 field reaches level of horizontal branch
Photometry • PSF-fitting photometry with DAOPHOT/ALLSTAR • Fits the core of the PSF (0.”44 diameter), neglecting the halo • Corrections applied to account for: • -difference between PSF and aperture magnitudes out to a diameter of 0.”66 (30 pixels): ~0.3 mags • -difference between 0.”66 diameter aperture magnitudes and 4.”4 diameter aperture magnitudes: ~0.4 - 0.6 mags • -spatial variability of the aperture correction • -transformation of magnitudes to standard system
Disk 2 field Photometric error analysis Bulge 2 field • Completeness and photometric errors calculated from extensive Monte Carlo simulations • Both simulations and analytical crowding calculation (Olsen, Blum, & Rigaut 2003) indicate that crowding dominates errors for bulge and inner disk; do not go as deep as expected in Disk 2 field • Restrict analysis to magnitudes with >50% completeness
Deriving the population mix • Build models from isochrones (Girardi et al. 2002): Age = 1, 3, 5, 10 Gyr; Z=0.0001, 0.0004, 0.001, 0.008, 0.019, 0.03; Salpeter IMF for bulge and inner disk; finer age grid for Disk 2 field • Apply photometric errors and incompleteness to models • Fit model mix to LFs using maximum likelihood analysis (Dolphin 1997, Olsen 1999, Dolphin 2002); assume E(H-K) from IRAS/ISO; solve age and Z; (m-M)0 = 24.45
Results Example: two fields with Bulge/Disk ~ 1 Fits are dominated by the oldest populations Fit to LF: P ~ 6 - 17%
M31’s Bulge and Inner Disk Population Box • Old ages, nearly solar metallicities dominate • Metal-poor intermediate-age populations are probably spurious • Luminosity-weighted age, [Fe/H] = 8 Gyr, 0.0 (-0.5) • Mass-weighted age, [Fe/H] = 8.3 Gyr, 0.0 (-0.4)
Radial Trends • Both bulge and disk are dominated by older stars • The bulge has nearly solar metallicity, in agreement with other studies • The lower disk metallicities are in general agreement with other studies
The Disk 2 Field Block et al. (2006): Suggest that a collision between M32 and M31 formed the rings ~210 Myr ago • 30% of stellar mass formed within last ~100-300 Myr: prominent signature from the 10 kpc ring! • 35% of the stellar mass appears ancient and metal-poor
An M31 Survey: 20-m Name r() SK B/D Klim Time(s) F1 1.97 15.0 7.4 24.1 21.8 Bulge1 2.05 15.1 6.7 24.1 24.9 F177 2.79 15.4 5.5 24.4 38.3 F174 2.59 15.4 5.3 24.4 38.3 F3 3.80 15.8 3.8 24.7 66.9 Bulge2 3.83 16.0 3.1 24.9 87.8 F4 3.98 16.1 2.7 25.0 100 F5 5.84 16.4 2.0 25.2 147 F170 6.08 16.5 1.9 25.3 168 Disk2 9.09 17.1 1.1 25.7 348 F2 11.9 17.8 0.3 26.1 776 F280 20.5 18.4 0.2 26.6 1767 Disk1 56.9 19.6 0.0 27.8 17476 1 hour exposure, S/N=5: J: 28.9 H: 28.0 K: 27.0 KHB~23.5, KMSTO~27 Local Group Survey (Massey et al. 2002) image
An M31 Survey: 30-m Name r() SK B/D Klim Time(s) F1 1.97 15.0 7.4 24.8 17.6 Bulge1 2.05 15.1 6.7 24.9 19.7 F177 2.79 15.4 5.5 25.1 27.9 F174 2.59 15.4 5.3 25.1 27.9 F3 3.80 15.8 3.8 25.4 44.2 Bulge2 3.83 16.0 3.1 25.5 55.3 F4 3.98 16.1 2.7 25.6 62.0 F5 5.84 16.4 2.0 25.8 86.3 F170 6.08 16.5 1.9 25.9 96.8 Disk2 9.09 17.1 1.1 26.2 188 F2 11.9 17.8 0.3 26.8 543 F280 20.5 18.4 0.2 27.5 1732 Disk1 56.9 19.6 0.0 29.1 32500 1 hour exposure, S/N=5: J: 29.8 H: 28.9 K: 27.9 KHB~23.5, KMSTO~27 Local Group Survey (Massey et al. 2002) image
An M31 Survey: 50-m Name r() SK B/D Klim Time(s) F1 1.97 15.0 7.4 25.6 12.8 Bulge1 2.05 15.1 6.7 25.7 14.1 F177 2.79 15.4 5.5 25.9 18.9 F174 2.59 15.4 5.3 25.9 18.9 F3 3.80 15.8 3.8 26.1 27.9 Bulge2 3.83 16.0 3.1 26.2 34.4 F4 3.98 16.1 2.7 26.3 38.8 F5 5.84 16.4 2.0 26.6 58.6 F170 6.08 16.5 1.9 26.6 68.7 Disk2 9.09 17.1 1.1 27.2 194 F2 11.9 17.8 0.3 28.1 849 F280 20.5 18.4 0.2 28.9 4170 Disk1 56.9 19.6 0.0 30.4 69500 1 hour exposure, S/N=5: J: 30.7 H: 29.8 K: 28.9 KHB~23.5, KMSTO~27 Local Group Survey (Massey et al. 2002) image
A GMT and TMT disk galaxy program • Imaging • GMT HRCAM and TMT IRIS broad-band imaging of ~10–100 galaxies out to 10 Mpc • ~10 pointings per galaxy • Having one telescope in each hemisphere would be ideal! • Spectroscopy • R~3500 @ 0.85 (Ca triplet) with <~0.”05 resolution is ideal for abundance gradients and velocities of RGB stars out to ~10 Mpc; TMT IRIS and IRMOS, GMT NIRMOS • High resolution R~25000 – 50000 spectroscopy will be provide important detailed abundances in the nearest galaxies; GMTNIRS, TMT NIRES and HROS (Smith talk) • Program needs 10–100 clear nights
Other Facilities Ibata et al. (2007) The low surface brightness regions far from galaxy centers are ideal places to study the late accretion histories of disk galaxies; needs wide fields (LSST, PanSTARRS), excellent site (PILOT), and deep imaging (JWST) Bland-Hawthorn et al. (2005)
Closing Thoughts The age and metallicity distributions of stars in bulges and disks are sensitive indicators of galaxy formation physics. Resolved stellar populations can be used to measure the entire star formation and chemical enrichment histories of galaxies. Spatial resolution is the most critical capability needed to measure the star formation histories of massive galaxies; we are just beginning to probe these galaxies. Photometry with ground-based adaptive optics on current and future large telescopes are excellent tools to allow us to measure the star formation histories in the bright components of massive galaxies. A program of measuring star formation histories from resolved stars in disk galaxies out to ~10 Mpc will provide an exciting and unique perspective on galaxy formation!
J-K Can we trust star formation histories derived from only evolved stars? • Compare star formation histories derived from 2MASS J-K, K CMD of the LMC Bar (Olsen, in prep.) to that derived from HST/WFPC2 (Dolphin 2002)
An NGC 3379 Survey: 20-m Name r() SKKlim Time(s) Re 30 17.0 24.6 197 3Re 90 19.3 27.2 22620 Rtot 190 22.5 31.1 KHB~29, KMSTO~32.5 Jarrett et al. (2002)
An NGC 3379 Survey: 30-m Name r () SKKlim Time(s) Re 30 17.0 25.7 282 3Re 90 19.3 28.5 47200 Rtot 190 22.5 31.6 KHB~29, KMSTO~32.5 Jarrett et al. (2002)
An NGC 3379 Survey: 50-m Name r() SKKlim Time(s) Re 30 17.0 27.0 496 3Re 90 19.3 30.2 175800 Rtot 190 22.5 32.6 KHB~29, KMSTO~32.5 Jarrett et al. (2002)
An NGC 3379 Survey: 100-m Name r() SKKlim Time(s) Re 30 17.0 28.8 1724 3Re 90 19.3 31.3 170000 Rtot 190 22.5 34.5 KHB~29, KMSTO~32.5 Jarrett et al. (2002)