Download
1 / 39
410 likes | 593 Views
Specific adsorption Fig.13.2.2 Potential more negative than PZC: decline & same regardless composition (GCS model) Potential more positive than PZC: depend specifically on the composition → specific adsorption of anions: their center: inner Helmholtz plane (IHP), x 1

E N D
Specific adsorption Fig.13.2.2 Potential more negative than PZC: decline & same regardless composition (GCS model) Potential more positive than PZC: depend specifically on the composition → specific adsorption of anions: their center: inner Helmholtz plane (IHP), x1 Fig.13.2.6 Br-
(i) Specifically adsorbed ion → considering the slopes of ziFΓi(H2O) vs. σM σM = -[FΓK+(H2O) – FΓBr-(H2O)] In the absence of specific adsorption: charge on the electrode is counterbalanced by the excess of one ion and a deficiency of the other (Fig.13.2.5) → Fig. 13.2.6: more positive than PZC → superequivalent adsorption of bromide (considering slopes & compare with Fig. 13.2.5) (ii) Esin-Markov effect: shift in PZC with change in electrolyte conc Table by “Grahame” → shift : linear with ln[activity] → slope: Esin-Markov coefficient at σM = 0 (non-specific adsorption: EM coeff = 0 (1/RT)(∂E±/∂lnasalt)σM = (∂E±/∂μsalt)σM
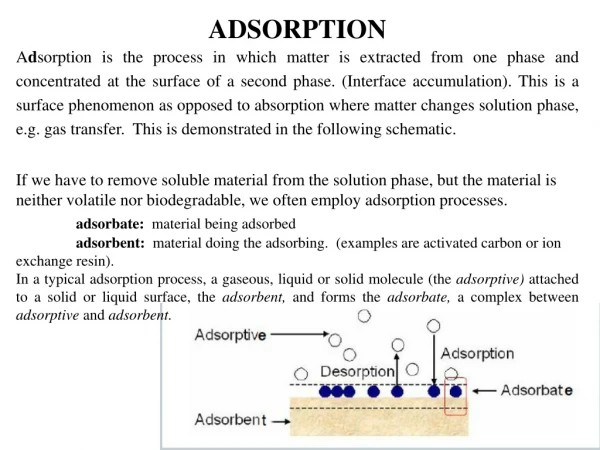
Studies at solid electrodes Double layer at solids 대부분 mercury에 대에 집중 → solid electrode: difficulty to reproduce same & clean surface, not atomically smooth… Well-defined single crystal electrode surfaces Different crystal faces exhibit different properties (e.g., PZC, work function..) Pt, Pd, Ag, Ni, Cu: FCC crystal structures → low-index crystal faces: stable, polishable → higher-index planes: more edges, step & kink sites Reconstruction: minimize surface energy Carbon: highly oriented pyrolytic graphite (HOPG)
Potential of zero charge cf. Pt: 0.18 V, Ni: -0.33 V
Different crystal faces exhibit different properties (e.g., PZC, work function..) e.g., PZC on Ag(111) (-0.69 V vs. SCE), Ag(110) (-0.98 V), → -0.8 V: carry negative charge in (111), positive charge in (110) Different catalytic & adsorption properties e.g., different CV in Pt (0.5 M H2SO4)
Solid metal-solution interface Information on PZC & interface from capacitance measurements Capacitance curves for Ag(100) at different conc of KPF6 and NaF (top to bottom 100, 40, 20, 10, and 5 mM) Independence of min in capacitance → weakly specificallyadsorbed on Ag PZC from capacitance minimum
PZC depends upon crystal faces (e.g., Ag) calculated: polycrystalline (46% (110), 23% (100), 31% (111))
Another complication: surface reconstruction Au(100): reconstructed (5 x 20) during flame heating < +0.5 V: maintained (5 x 20) ~+0.7 V: converted to original (100)
Extent and rate of specific adsorption Nature and extent of specific adsorption Commensurate: molecules adsorb in exact corresponding pattern with surface atoms e.g., 1.5 x 10¹⁵ Au atoms/cm2 on Au(111), spacing 2.9 Å → if adsorbate atoms on atop sites: (1 x 1) superlattice (2.5 x 10⁻⁹ mol/cm2) Iodine or 4-aminothiophenol: (√30 x √30)R30° → 1/3 Au (8.3 x 10⁻¹⁰ mol/cm2) Lower coverage for larger molecules
Roughness factor: actual area/projected area (~1.5 – 2 for smooth electrode) • Adsorption isotherms • Equal electrochemical potentials for bulk & adsorbed species i at equilibrium • μiA = μib • μi0,A + RT ln aiA = μi0,b + RT ln aib • Standard free energy of adsorption • Gi0 = μi0,A – μi0,b • aiA = aib e-Gi0/RT = βiaib • Where βi = exp(-Gi0/RT) • Langmuir isotherm • Assumption: • No interactions between the adsorbed species on the electrode surface • No heterogeneity of the surface • At high bulk activities, saturation coverage of the electrode by adsorbate (e.g., to form a monolayer) of amount of Γs • Γi/(Γs – Γi) = βiaib • Fractional coverage, θ = Γi/Γs • θ/(1 – θ) = βiaib
Γi = ΓsβiCi/(1 + βiCi) If two species i & j are adsorbed competitively, Γi = Γi,sβiCi/(1 + βi + βj) Γj = Γj,sβjCj/(1 + βi + βj) Logarithmic Temkin isotherm Interactions between adsorbed species Γi = (RT/2g)ln(βiaib) (0.2 < θ < 0.8) Frumkin isotherm Electrochemical free energy of adsorption is linearly related to Γi Gi0(Frumkin) = Gi0i(Langmuir) – 2gΓi βiaib = [Γi/(Γs - Γi)]exp(-2gΓi/RT) g: J/mol per mol/cm2 → increased coverage changes the adsorption E of i Positive g: interactions between adsorbed molecules are attractive Negative g: repulsive interactions As g → 0, Frumkin isotherm approaches the Langmuir isotherm
Rate of adsorption When βiCi << 1, Γi = ΓsβiCi = biCi Where bi = βiΓs Γi(t) = biCi(0,t) Ci(x,0) = Ci*, lim Ci(x,t) = Ci* Γi(t) = ∫ Di[∂Ci(x,t)/∂x]x=0 dt → Γi(t)/Γi = 1 – exp(Dit/bi2)erfc[(Dit)1/2/bi] Γi(t)/Γi is independent of Ci*, but actually depend on. bC*/Γs
Effect of adsorption of electroinactive species → such adsorption inhibit (or poison) an electrode reaction or accelerate the electrode reaction (e.g., hydrogen or oxygen) k0 = kθ=00(1 – θ) + kc0θ Where kθ=00 is the standard rate const at the bare surface & kc0 that at the filmed portions For completer blockage by the film, kc0 = 0 For catalysis by the filmed area, kc0 > kθ=00 Effect of adsorbed substances Hydrogen & oxygen CO & organics
Summary Electrochemical potential (μi) = (∂G/∂ni): const at equilibrium Surface tension (γ) = (∂G/∂A): a measure of the energy required to produce a unit area of new surface Surface excess concentration (Γi) = ni/A: excess per unit area of surface Gibbs adsorption isotherm: -dγ = Σγidμi for general interface Electrocapillary equation: -dγ = σMdE + ΣΓidμi for electrochemical interface The excess charge density on the metallic side of interface: σM = -σS → surface tension (γ) vs. charge density: σM = -(∂γ/∂E)μ
Surface tension (γ) vs. charge density: σM = (∂γ/∂E)μ Curve slope = 0: “potential of zero charge”(pzc) σM = σS = 0 - excess charge Exp. Cd = (∂σM /∂E)

![protein adsorption [%]](https://cdn3.slideserve.com/5518059/slide1-dt.jpg)