Download
1 / 13
160 likes | 272 Views
Measurement Uncertainty and Traceability. CLEEN MMEA Certainty Seminar 6.11.2013 MIKES, Espoo Maija Ojanen Maija.Ojanen@mikes.fi. Introduction. Why should we estimate measurement uncertainty? To estimate the reliability of the results To compare different results and measurement methods

E N D
Measurement Uncertainty and Traceability CLEEN MMEA Certainty Seminar 6.11.2013 MIKES, Espoo Maija Ojanen Maija.Ojanen@mikes.fi
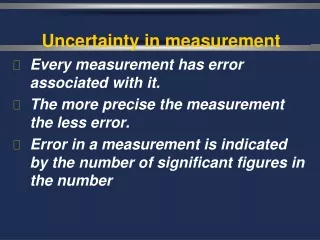
Introduction • Why should we estimate measurement uncertainty? • To estimate the reliability of the results • To compare different results and measurement methods • To see if the device meets its specifications • To be cost efficient • To know in which applications the results can be used !!! Maija Ojanen
Identification of uncertainty components • Measurement device • Stability • Needs to be studied based on successive calibrations • Linearity • Hysteresis • Resolution • Drift… • Deviation of the results, sampling • Measurement procedure • Environmental conditions • Temperature, vibration, relative humidity, air pressure, gravitation, air flow, … • Change in the above mentioned can result in significant effect in the measurement result • Calibrations typically done in well-controlled laboratory conditions! Maija Ojanen
Uncertainty classification • Type A uncertainty • Can be evaluated by statistical methods • Type B uncertainty • Evaluated by other means: calibration certificate, specifications, literature, earlier experience etc. • Cannot be improved by repeating the measurements! • Standard uncertainty • Combined standard uncertainty • Expanded uncertainty Maija Ojanen
Uncertainty analysis • Express in mathematical terms the dependence of the measurand (output quantity) on the input quantities. In the case of a direct comparison of two standards the equation may be very simple, e.g. Y = X1+X2. • Identify and apply all significant corrections. • List all sources of uncertainty in the form of an uncertainty analysis. • Calculate the standard uncertainty for repeatedly measured quantities (type A uncertainty). • Evaluate type B uncertainty by other means. • Calculate for each input quantity the contribution to the uncertainty associated with the output estimate resulting from the input estimate and sum their squares to obtain the square of the combined standard uncertainty of the measurand. If input quantities are known to be correlated, the associated covariances must be included. • Calculate the expanded uncertainty by multiplying the standard uncertainty associated with the output estimate by a coverage factork (typically k = 2 -> 95 % confidence level). Maija Ojanen
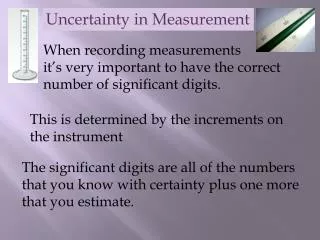
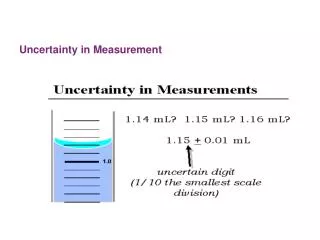
Uncertainty distributions • Gaussian distribution • Uncertainty from calibration certificate • Repeatability • Standard uncertainty = standard deviation (1 σ) • Rectangular distribution • Resolution of digital display • Manufacturer specifications • Triangular distribution • Difference of two rounded values ±1 σ ±2 σ Maija Ojanen
Calculation example • The measurand Y depends on input quantities Xi • Using relative uncertainties (xi /Xi) multiplied and divided input quantities produce an equal relative uncertainty in the measurand • If the input quantity is raised to nth power, the resulting relative uncertainty in the measurand is n-tuple Maija Ojanen
Calculation example • Combined standard uncertainty is calculated as a square sum of the uncertainty components • Expanded uncertainty is calculated by multiplying the combined standard uncertainty by a chosen coverage factor k (typically k = 2) • Note: in this example all the input quantities are non-correlated! Maija Ojanen
Correlation • Two input quantities dependent on each other • Common calibration reference • E.g. measurement of a 5-m distance with a 1-m ruler: measured distance is a sum of five separate measurements with same error/uncertainty • Effect of correlation must be studied case by case; no general model • Can either increase or decrease the combined standard uncertainty Maija Ojanen
Example of an uncertainty budget • “Any detailed report of the uncertainty should consist of a complete list of the components, specifying for each the method used to obtain its numerical value” P. Kärhä, P. Toivanen, F. Manoochehri, and E. Ikonen, “Development of a detector-based absolute spectral irradiance scale in the 380-900-nm spectral range,” Appl. Opt. 36, 8909 - 8918(1997). Maija Ojanen
Precision vs. accuracy Maija Ojanen
Traceability Maija Ojanen
Literature • BIPM, IEC, IFCC, ISO, IUPAC, UIPAP, OIML. JCGM 100:2008 Evaluation of measurement data -Guide to the Expression of Uncertainty in Measurement. (GUM 1995 with minor corrections), 2008 • European cooperation for Accreditation, EA-4/02 Expression of the Uncertainty of Measurement in Calibration, December 1999. Maija Ojanen