Download

1 / 27
270 likes | 284 Views
Histograms – Chapter 4. Huh?. That image is too contrasty. The colors aren’t vibrant enough. I want the reds to pop. It doesn’t have a warm enough feel. etc. etc. etc. The industry is rife with such statements that no one really knows how to interpret consistently. Some examples.

E N D
Huh? • That image is too contrasty. • The colors aren’t vibrant enough. • I want the reds to pop. • It doesn’t have a warm enough feel. • etc. etc. etc. • The industry is rife with such statements that no one really knows how to interpret consistently
The goal • We know when a picture “looks” good • We know when a picture “looks” bad • But this is purely subjective • Sometimes we know what the reality is • But sometimes one person’s reality is different than another’s • Sometimes we have no idea what reality is • The scene we photographed is long gone • We need a way to quantify our findings
Statistics… • Figures often beguile me, particularly when I have the arranging of them myself; in which case the remark attributed to Disraeli would often apply with justice and force: "There are three kinds of lies: lies, damned lies and statistics." – Mark Twain
Statistics • Statistics can tell us a lot about an image • Quality of exposure • Image manipulations • Compression/quantization
Statistics • But if we compute the statistics in the “usual way” all we get is a bunch more numbers to look at • Min • Max • Mean • Mode • Skew • Standard deviation • etc. • A picture is worth a thousand words (or number in this case)
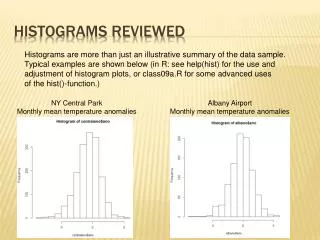
Histogram • Pictorial depiction of image statistics
Histogram • The pixels within an image are arranged in a spatially coherent manner • What does that mean? • Their position in the image matters • A histogram is a frequency distribution of the pixel values within an image • What does that mean? • It depicts the number of times a particular pixel value occurs in the image
Histogram • Mathematically speaking… • In words: h(i) is the number of pixels in the image I who’s value is i • It will contain an array of values, 1 for each possible pixel value K
Histogram • The histogram does not contain any spatial information whatsoever! • Can you reconstruct the original image from the histogram? • No, just like if I give you a bunch of statistics you can’t recreate the original dataset!
What can you do with a histogram? • Image Acquisition – exposure • Where the concentration of pixel values lie within the histogram • Laymen’s (subjective) terms: how bright or dark is the image
What can you do with a histogram? • Image acquisition – contrast • How much of the pixel value range is effectively used • Note that “effectively” is yet another subjective term • Laymen’s (subjective) term: how foggy is the image
What can you do with a histogram? • Image acquisition – dynamic range • The number of distinct pixel values in the image • Often times this dynamic range will consider how much “noise” (unstructured, unwanted, unintended, modifications of the pixel values) as part of the definition • Laymen’s (subjective) term: how posterized or contoured is the image
Test image • Exposure? • Contrast? • Dynamic range?
ImageJ • Open snake.png (download from my web site) • Select Analyze/Histogram • This is the histogram of the luminance channel of the color image • Select Image/Color/Split Channels • You now have the red/green/blue channels individually • Create histograms of each of these • Comment on exposure, contrast, dynamic range • Pull other images from wherever, play with it