Download
1 / 15
180 likes | 436 Views
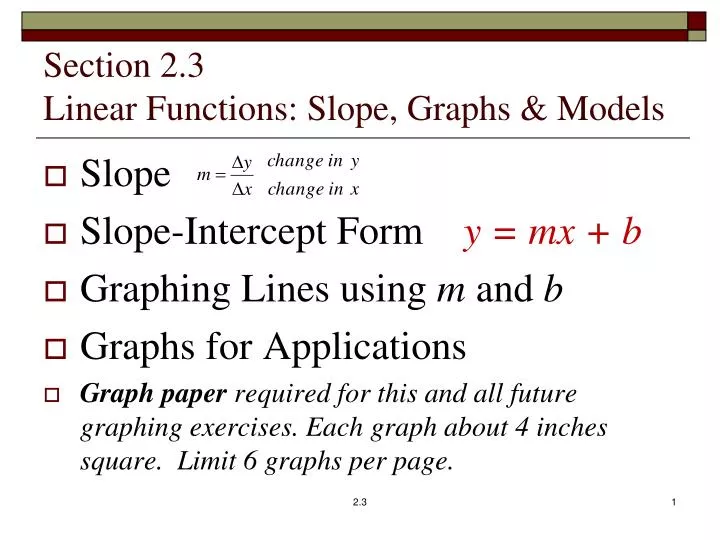
Section 2.3 Linear Functions: Slope, Graphs & Models. Slope Slope-Intercept Form y = mx + b Graphing Lines using m and b Graphs for Applications Graph paper required for this and all future graphing exercises. Each graph about 4 inches square. Limit 6 graphs per page.

E N D
Section 2.3Linear Functions: Slope, Graphs & Models • Slope • Slope-Intercept Form y = mx + b • Graphing Lines using m and b • Graphs for Applications • Graph paper required for this and all future graphing exercises. Each graph about 4 inches square. Limit 6 graphs per page. 2.3
What is Slope & Why is it Important? • Using any 2 points on a straight line will compute to the same slope. 2.3
The Dope on Slope • On a graph, the average rate of change isthe ratio of the changein yto the change in x • For straight lines, the slope is the rate of change between any 2 different points • The letter mis used to signify a line’s slope • The slope of a line passing through the two points (x1,y1) and (x2,y2) can be computed: • Horizontal lines (like y = 3 ) have slope 0 • Vertical lines (like x = -5 ) have an undefined slope • Parallel lines have the same slope m1 = m2 • Perpendicular lines have negative reciprocal slopes m1=-1/m2 2.3
Slope Intercept Form of a Straight Linef(x) = mx + b or y = mx + b • Both lines have the same slope, m = 2 2.3
Using b to identify the y-intercept point (0,b) • the above y-intercepts are: (0,0)and (0,-2) • What’s the y-intercept of y = -5x + 4 (0,4) • What’s the y-intercept of y = 5.3x - 12 (0,-12) 2.3
Graphing a Straight Line using the y-intercept and the slope 2.3
Next • Section 2.4 Another Look at Linear Graphs 2.3