Download

1 / 27
270 likes | 461 Views
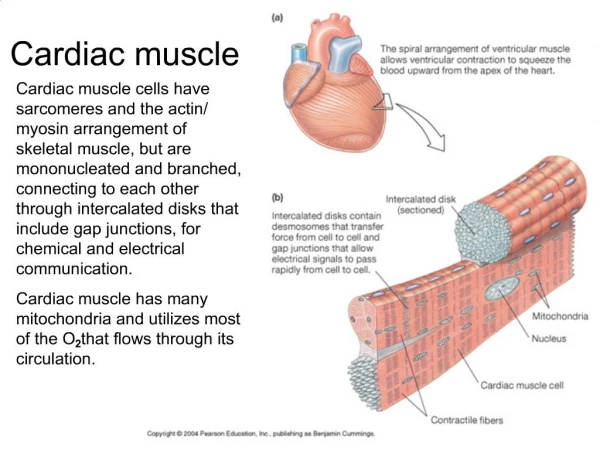
Refractory period of cardiac muscle. cardiac muscle has refractory period, preventing restimulation during this interval, a normal cardiac impulse cannot re-excite an already excited area of the heart ventricles: 0.25-0.30 sec

E N D
Refractory period of cardiac muscle • cardiac muscle has refractory period, preventing restimulation • during this interval, a normal cardiac impulse cannot re-excite an already excited area of the heart • ventricles: 0.25-0.30 sec • another, relative refractory period of 0.05 sec, muscle is more difficult to excite, but can be stimulated
atria: ~0.15 sec • relative refractory: 0.03 sec • rhythmical rate of atria can be faster than that of ventricles
Cardiac Cycle • beginning of heart beat to beginning of the next • R to R or P to P wave is often how one is measured
Systole and Diastole • relaxation phase: heart fills with blood, diastole • work phase: heart pumps blood, systole • cardiac cycle curve
Diastole • first third: rapid filling • middle third: small amount of filling • last third: atria contract, ~25% of blood flows into ventricles
Systole • Isovolumic or isovolumetric contraction occurs at onset of ventricular contraction • ventricles need to develop sufficient pressure to open semilunar valves against the aorta and pulmonary artery • ventricles contract isometrically, volume does not change
Ejection next • pressure in L vent. >80 mm Hg and R vent. > 8 mm Hg, valves open • first third: rapid ejection, 70% of blood is ejected • next two-thirds: final 30% is ejected, slow ejection • isovolumic relaxation • sudden onset, rapid drop in pressure, no change in volume • intraventricular pressure drops to diastolic level
End Diastolic Volume (EDV) • volume in ventricles after the period of filling • usually ~110-120 ml of blood/ventricle
Stroke Volume (SV) • volume ejected during systole • ~70 ml
End Systolic Volume (ESV) • volume in ventricles after systole, ~40-50 ml
Ejection Fraction (EF) • fraction of EDV that is ejected • usually ~ 60% • when contraction force is strong, ESV can fall to 10-20 ml • EDV can be as high as 150-180 ml of blood • increase EDV and decrease ESV, SV can double resting SV
Volume Pressure curves for Systole and Diastole • Phase I: filling phase ESV to EDV increase vol. ~70 ml pressure rises ~5 mm Hg (diastolic) • Phase II: isovolumic contraction, increase pressure (~80 mm Hg), not volume
Phase III: ejection period • Phase IV: isovolumic relaxation ventricle pressure decreases to diastolic levels
Preload: degree of tension on the heart muscle when it begins contraction • Volume of blood in the ventricle at the end of diastole (EDV)
Afterload: load against which the muscle exerts its contractile force • Pressure in artery leading from the ventricles
Regulation of the heart’s pumping • @ rest, Q is usually 4-6 l/min • Q is reliant upon rate of blood flow into heart (venous return) • Frank-Starling Mechanism: increase in venous return (EDV) increases the amount of blood pumped into the aorta
F-S: Heart pumps what heart gets • Due to increased return: increased stretch of the heart increase force of the contraction (optimal length for force) • Increase in force is also seen in skeletal muscle • Stretch R atrial wall can increase heart rate by 10-20% increasing Q (less than from F-S mechanism) • High pressure in the arteries does not increase Q
Ventricular Function Curves As arterial pressure increases, work output of stroke volume increases until it reaches the limit of the heart As arterial pressure increases (EDV) EF also increases
Extrinsic Regulation of the Heart Rate • Neural influences can be superimposed on inherent rhythmicity of heart • Originate in CVC in medulla • Transmitted via autonomic NS via sympathetic and parasympathetic • Ventricles: sympathetic • Atria: both
Sympathetic Innervation • Can increase Q by 100% • Causes release of epi and norepi, speeding rate of SA depolarization • Result: tachycardia • Also increases the force of contraction • Inhibition of sympathetic NS can decrease HR and pumping
Mechanism the continuously discharges, maintains HR ~30% higher than if there were no stimulation • If depress sympathetic stimulation, HR and force of contraction decrease, decreasing Q ~30% • Adrenal glands are also active and can release epi with general sympathetic activation
Parasympathetic innervation • Can slow HR to almost zero • Ach released, decreasing the rate of sinus discharge: bradycardia • Cell bodies are in cardioinhibitory center of medulla • With strong stimulus, heart can stop beating for few seconds, start again, at a rate of 20-30 bpm
Strong parasympathetic stimulation will decrease the force of contraction by 20-30% • Decrease is not great in its extent, most fibers are in atria, few in ventricles • Large decrease in HR combined with small decrease in contractility: decrease ventricular pumping 50%
Training Effect • Exercise favors vagal dominance • Increase in parasympathetic activity, may also have a decrease in sympathetic activity • Training may also reduce intrinsic firing rate of SA node
Peripheral input • Peripheral receptors in blood vessels, joints, muscles • Input to ventrolateral medulla • Modify vagal or sympathetic outflow • Baroreceptors in aortic arch and carotid sinus (alterations in BP)
Increase BP: reflex slowing of HR and dilation of peripheral vasculature • Decrease BP to normal levels • This feedback is overridden during exercise • But, still may act to prevent abnormally high BP during ex.