Download
1 / 98
980 likes | 1.14k Views
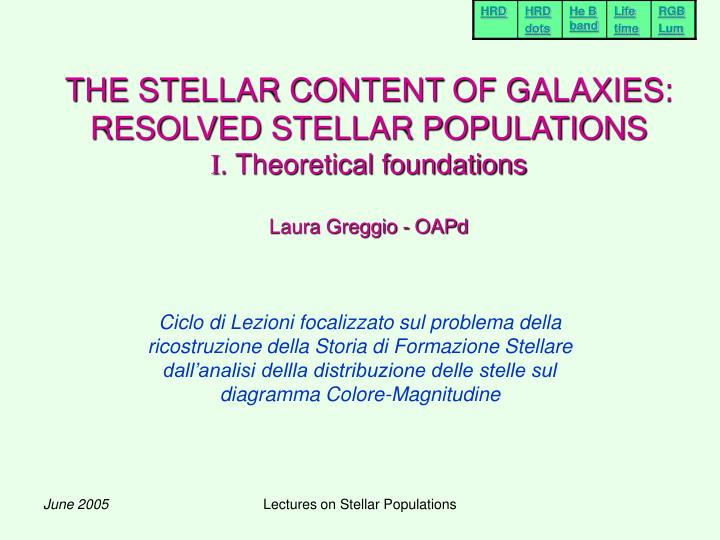
THE STELLAR CONTENT OF GALAXIES: RESOLVED STELLAR POPULATIONS I . Theoretical foundations Laura Greggio - OAPd. Ciclo di Lezioni focalizzato sul problema della ricostruzione della Storia di Formazione Stellare dall’analisi dellla distribuzione delle stelle sul diagramma Colore-Magnitudine.

E N D
THE STELLAR CONTENT OF GALAXIES: RESOLVED STELLAR POPULATIONSI. Theoretical foundationsLaura Greggio - OAPd Ciclo di Lezioni focalizzato sul problema della ricostruzione della Storia di Formazione Stellare dall’analisi dellla distribuzione delle stelle sul diagramma Colore-Magnitudine Lectures on Stellar Populations
Carina: Dwarf Spheroidal Monelli et al. 2004 Lectures on Stellar Populations
DISK FIELD BAR FIELD Recent enhancement (from 0.1 Gyr ago) Enhancement at 3.5 Gyr ago Old SF (from 10-3.0 Gyr ago) Large Magellanic Cloud Smecker-Hane et al. 2002 Lectures on Stellar Populations
NGC 1705 – A Dwarf Blue Galaxy observations interpretation Annibali et al. 2003 Lectures on Stellar Populations
Simulations: Color Coding Reflects AGE(Myr): <10Myr 10↔60 60↔1000 > 1000 SFR constant from 10 Myr to 2 Gyr ago SFR constant from now to 1 Gyr ago Lectures on Stellar Populations
Outline of the Course: • Summary of Stellar Evolution Review of general properties of stellar tracks, which determine the appearance of the HRD and its systematics. • Bolometric Corrections and Colors How we transform from the theoretical (Log L, Log Teff) plane to the observational (Mag,Color) • Basic Relations between Stellar Counts in Selected Regions of the CMD and the SF History Illustrate potentials and limitations of the synthetic CMD method • The Simulator and Some Examples Various technicalities, including the treatment of photometric errors Lectures on Stellar Populations
100 MO ZAMS 2.5 MO 20 MO PAGB0.6 MO PN 5 MO 5 MO 2.5 MO 2.5 MO RGB ZAHB To WD 1 MO 1MO Evolutionary Tracks Padova 94 set Z=Zo Y=0.28 Lectures on Stellar Populations
100Ro 2 Mo 0.8 Mo RGB Bump 10 Ro RGB evolution Back to HRD Lectures on Stellar Populations
1.2 Mo 1 Mo RGB : bump and LF Back to HRD Lectures on Stellar Populations
RGB tip 1 Ro 10 Ro 100 Ro RGB tip P-EAGB RGB base 0.12 0.07 0.03 M tr Flash and After Back to HRD Lectures on Stellar Populations
15 Age indicator Distance ind Lmax,He 9 Mo 7 6 TRGB Lmin,He 5 4 3 2.2 Mo 10 Ro ZAHB Clump and Loops Back to HRD Lectures on Stellar Populations
BUMP RGB 5 Mo 4 Mo 3 Mo 2.2 Mo BUMP 1.5 Mo with cost=-0.5 RGB 1 Mo with cost=-1 AGB Bump Lectures on Stellar Populations
Clump Clump Bump Bump Bump PMS LFRGBHBAGB Lectures on Stellar Populations
TAGB Ist Pulse TRGB First Pulse and TAGB Lectures on Stellar Populations
Massive Stars Evolution affected by MASS LOSS OVERSHOOTING Chiosi and Maeder 1986 Lectures on Stellar Populations
BSG RSG WR C stars Miras Ceph Clump HB RRLyr WD Where the Stars are Back to HRD Dots are equally spaced in There are 1000 dots along each track Lectures on Stellar Populations
30 Mo 15 Mo 5 Mo AGB Manque’ 3 Mo Clumps Post E-AGB Clumps 0.9 Mo 0.55 Mo 0.6 Mo 0.5 Mo Dependence on Metallicity Lectures on Stellar Populations
RGB phase transition overshooting tot He burning MS rgb Evolutionary Lifetimes Lectures on Stellar Populations
TIP Base RGB Luminosities Lectures on Stellar Populations
Ist Pulse He burn L-band RGB trans Helium Burning and beyond Lectures on Stellar Populations
Isochrones Girardi et al. 2002 • As Z increases: • isochrones get • fainter and redder • loops get shorter • WR stars are more • easily produced Lectures on Stellar Populations
Uncertainties and wish list Core Convection: affects star’s luminosity H and He lifetimes shape of tracks around Mhook first H shell burning and runway for intermediate mass stars MS width location of RGB bump values of Mtr and Mup ratios N(HB)/N(AGB) loops extension Mass Loss: on the RGBaffects Temperature extension of HB on the AGB affects value of Mup and TAGB for massive stars affects surface abundances, upper limit of Red SGs, productions of WR .. Opacity: affects MS width occurrence and extension of loops Blue to Red ratio Mixing Length, rotation, diffusion, meridional circulation, nuclear reactions… Separate dependence on Y and Z is important Lectures on Stellar Populations
What have we learnt To place on the HRD whatever mass at whatever age we want to pay attention to: • Mtr Mup Mhook : lifetimes and tracks discontinuities • Place correctly RGB Tip (as distance indicator) • Describe accurately the evolution in core He burning close to RGB transition (Lum extension during evolution) • Allow spread of envelope masses for HB stars • Describe extension of the loops, location of BSG, Back-to-the-Blue evolution of high mass stars • …………. AND if we include a metallicity spread Correctly describe all these systematics as a function of Metallicity Lectures on Stellar Populations
Bolometric Correctionsand Colors depends on .... stellar radius system throughput We do not observe Bolometric, we observe through filters: depends on Teff, gravity and Z Lectures on Stellar Populations
Average of Observed Stellar Spectra:Dwarfs SpT T(K) F c.g.s. Lectures on Stellar Populations
B V I U Dwarfs SED & Filters BC strongly depends on SpT Cool stars detected in Red Hot stars detected in Blue COLORS: are Temperature Indicators Cool stars are Red Hot stars are Blue Lectures on Stellar Populations
B0 M5 B5 M2 K5 A0 Effect of gravity Gravity effects are very Important for very hot And very cool stars Lectures on Stellar Populations
Johnson 1966 ARAA 4 193 COLORS: Empirical B-V colors are good Teff indicators for late A, F, G and early K stars For Hot stars SpT is preferred Lectures on Stellar Populations
Bolometric Corrections: Empirical Hottest and Coolest stars are 3-4 mags fainter in V than in Bolometric Gravity dependence can amount to 0.5mags Lectures on Stellar Populations
Models Empirical Model Atmospheres:Kurucz Grid revised by Castelli Lectures on Stellar Populations
Model Atmospheres:dependence on gravity Models Empirical Lectures on Stellar Populations
Molecules Blanketing Model Atmospheres:dependence on Metallicity Lectures on Stellar Populations
Model Atmospheres:Calibration • The Models do a good job for the SED of Dwarfs, especially for intermediate Spectral Types • Not too bad for Giants and Supergiants also • Major problems are met al low Temperatures (Opacity, Molecules) • Anyway, the use of Model Atmospheres becomes a MUST because: they allow us to compute Colors and BCs for various Metallicities AND for whatever filters combinations To do that we: Take a grid of Models Perform calibration Produce Tables of BC, Col function of (Teff ,Log g, [M/H]) Lectures on Stellar Populations
Balmer Jump Go Back Lectures on Stellar Populations
Colors from Model Atmospheres Origlia and Leitherer 1998: Bessel, Castelli and Pletz models through Ground Based Filters Lectures on Stellar Populations
Bolometric Correction from Model Atmospheres Nice and smooth BUT Probably off for Late K and M stars Have you noticed that lines of different colors Span different Temperature Range? THIS IS NOT A SUPERMONGO FALIURE: Lectures on Stellar Populations
Tracks on the Log Teff – Log g Plane WE LACK LOW GRAVITY MODELS FOR MASSIVE STARS WE LACK LOW TEMPERATURE AND LOW GRAVITY MODELS FOR LOW MASS STARS (AT HIGH METALLICITIES) Lectures on Stellar Populations
M&M: attach empirical calibrations Go back Montegriffo et al. (1998) traslated Lectures on Stellar Populations
Bessel, Castelli & Pletz (1998, A&A 333, 231) Compare Kurucz’s revised models (ATLAS9)+ Gustafsson et al revised (NMARCS) models for red dwarfs and giants to empirical colors and BCs for stars in the Solar Neighbourhood (i.e. about solar metallicity). They show color-temperature, color-color, and BC-color relations. Conclude that : • There is a general good agreement for most of the parameter space • B-V predicted too blue for late type stars, likely due to missing atomic and molecular opacity • NMARCS to be preferred to ATLAS9 below 4000 K Lectures on Stellar Populations
A-K Dwarfs Hot Dwarfs GKM Giants The models are shown as curves The data are shown as points The ptype encodes the literature source Lectures on Stellar Populations
NM K Dwarfs Giants Lectures on Stellar Populations
Dwarfs Giants Dwarfs Lectures on Stellar Populations
BaSeL Grid(Lejeune, Cuisinier and Buser 1997 +) • Collect Model Atmospheres from Kurucz • +Bessel + Fluks (for RGs) + Allard (for M dwarfs) • Correct the model spectra so as to match empirical • calibration • Put the corrected models on the net Lectures on Stellar Populations
Lejeune Models: Z dependenceCheck with Globulars’ Ridge Lines BaSeL 2.2 : Corrected Models at solar Z & Z theoretical dependence BaSeL 3.1: Corrected models at various Z based on GCs Ridge Lines 5 GGs with [Fe/H]=-2.2 to -0.7 in UBVRIJHKL For each get Te from V-K (using BaSel 2.2) BCs vs (Te,g) BaSeL 3.1 Padova 2000: Correction at various Z made to match GCs Ridge Lines with Padova 2000 isochrones ”It is virtually impossible to establish a unique calibration In terms of Z which is consistent with both color –temperature Relations AND GCs ridge lines (with existing isochrones)” Westera et al. 2002 Lectures on Stellar Populations
Libraries with high Spectral resolution Recently developed for Population Synthesis Studies, Stellar spectroscopy, Automatic Classification of Stellar and Galaxy Spectra … not so important for Broad Band Colors Observational Libraries take a sample of well observed stars with known parameters Log Te, Log g, [Fe/H] and derive their spectra INDO-US – Valdes et al. 2004 885 spectra between 3460 and 9464 A + 400 with smaller wavelength range sp. res. ~ 1 A STELIB – Le Borgne et al. 2003 249 spectra between 3200 and 9500 A, sp.res. ~ 3 A Lectures on Stellar Populations
Libraries with high Spectral resolution THEORETICAL MODELS Usually constructed on top of a model atmosphere (Kurucz) + Code for synthetic spectrum which solves monochromatic radiative transport with a large list of lines not very important for broad band colors, but could suggest diagnostic tools Martins et al. 2005: 1654 spectra between 3000 and 7000 A with sp. res. ~0.3 A Special care to describe non-LTE and sphericity effects Lectures on Stellar Populations
Check versus STELIB stars Check versus INDO-US stars Martins et al. 2005 30000 4.5 0.02 3500 1.0 0.01 3700 1.3 0.01 30262 4.18 0.02 14000 4.5 0.02 4000 1.0 0.02 3910 1.6 0.01 13622 3.80 0.05 7000 4.0 0.02 3500 0.0 0.02 3540 0 0.02 7031 4.04 0.01 4540 0.88 0.02 4500 0.0 0.01 Lectures on Stellar Populations
Other Models: Munari et al. : 67800 spectra between 2500 and 10500 A with res of ~1 A cover Te from 3500 to 47500 K, Log g from 0 to 5 [M/H] from -2.5 to +0.5 and [A/Fe]=0,+0.4 Bertone et al. : 2500 spectra with resolution of ~ 0.3 A UV grid Optical grid between 850 and 4750 A 3500 and 7000 A Te from 3000 to 50000 K 4000 to 50000 K Log g from 1 to 5 0 to 5 [M/H] from -2.5 to +0.5 -3 to +0.3 Coelho et al. : spectra between 3000 and 1800 A with res of ~0.02 A cover Te from 3500 to 7000 K, Log g from 0 to 5 [M/H] from -2.5 to +0.5 and [A/Fe]=0,+0.4 Lectures on Stellar Populations
Converted Tracks: B and V Lectures on Stellar Populations
Converted Tracks: V and I Lectures on Stellar Populations