Download
1 / 55
550 likes | 699 Views
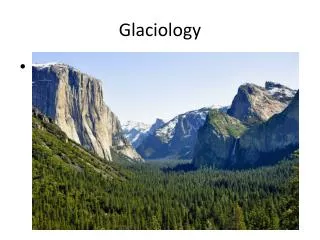
Radar Informatics (with application to glaciology). Jerome E. Mitchell School of Informatics and Computing. 1992. 2000. 2005. Outline. Background – Remote Sensing Background – Global Climate Change Radar Overview Radar Basics Ice Sheet Science What Are We Doing? How Are We Doing It?.

E N D
Radar Informatics (with application to glaciology) Jerome E. Mitchell School of Informatics and Computing
Outline • Background – Remote Sensing • Background – Global Climate Change • Radar Overview • Radar Basics • Ice Sheet Science • What Are We Doing? • How Are We Doing It?
Outline • Background – Remote Sensing • Background – Global Climate Change • Radar Overview • Radar Basics • Ice Sheet Science • What Are We Doing? • How Are We Doing It?
What is Remote Sensing? • Remote Sensing is the art and science of • Acquiring • Processing and • Interpreting Images and related data obtained from ground-based, air or space-borne instruments, which record the interaction between a target and electromagnetic radiation
History of Remote Sensing 1903 - The Bavarian Pigeon Corps 1909 - Dresden International Photographic Exhibition
History of Remote Sensing 1908 - First photos from an airplane 1914-1918 - World War I First flight, Wright Bros., Dec. 1903
Types of Remote Sensing • Passive: uses natural energy, either reflected sunlight (solar energy) or emitted thermal or microwave radiation. • Active: sensor creates its own energy • Transmitted toward Earth or other targets • Interacts with atmosphere and/or surface • Reflects back toward sensor (backscatter) • Advantages: all weathers and all times
Remote Sensing Applications • Land-Use Mapping • Forest and Agriculture • Telecommunication Planning • Environmental • Hydrology and Coastal Mapping • Urban Planning • Emergencies and Hazards • Global Change and Meteorology
Outline • Background – Remote Sensing • Background – Global Climate Change • Radar Overview • Radar Basics • Ice Sheet Science • What Are We Doing? • How Are We Doing It?
Global warming causing new evolutionary patterns EXAGGERATED SCIENCEHow Global Warming Research is Creating a Climate of Fear Global warming could burn insurersActivists call on industry to act Seattle mayors' meeting a cozy climate for business In a Shift, White House Cites Global Warming as a Problem Research Links Global Warming to Wildfires Is Global Warming Fueling Katrina? Rise in wild fires a result of climate change Seattle reports milestone in cutting emissions Jellyfish creature the answer to global warming? www.Scienceblog.com How one number touched off big climate-change fight at UW
Background • Sea-level rise resulting from the changing global climate is expected to directly impact many millions of people living in low-lying coastal regions. • Accelerated discharge from polar outlet glaciers is unpredictable and represents a significant threat. • Predictive models of ice sheet behavior require knowledge of the bed conditions, specifically basal topography and whether the bed is frozen or wet
Ice Sheet and Sea Level Greenland: 1.8 x 10⁶ km2 area (enough water to raise sea level about 7 meters) Antarctica: 1.3 x 10⁷ km2 area (enough water to raise sea level about 60 meters)
Disappearing Arctic Sea Ice Summer 1979 Summer 2003
Background – Remote Sensing • Background – Global Climate Change • Radar Overview • Radar Basics • Ice Sheet Science • What Are We Doing? • How Are We Doing It?
Ice melt flows down to bedrock through crevasses and moulins • Water between bedrock and ice sheet acts as lubricant • Allows ice sheet to move faster toward the coastline
Outline • Background – Remote Sensing • Background – Global Climate Change • Radar Overview • Radar Basics • Ice Sheet Science • What Are We Doing? • How Are We Doing It?
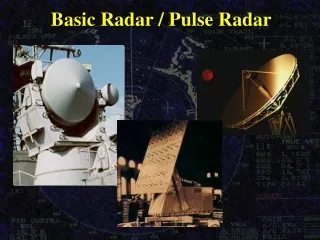
A Brief Overview of Radar • various classes of operation • Pulsed vs. continuous wave (CW) • measurement capabilities • Detection, Ranging • Position (range and direction), Radial velocity (Doppler) • Target characteristics
A Brief Overview of Radar • active sensor • Provides its own illumination Operates in day and night Largely immune to smoke, haze, fog, rain, snow, … • Involves both a transmitter and a receiver • Related technologies are purely passive • Radio astronomy, radiometers • Configurations • monostatic transmitter and receiver co-located • bistatic transmitter and receiver separated • multistatic multiple transmitters and/or receivers • passive exploits non-cooperative illuminator
A Brief Overview of Radar • radar – radio detection and ranging • developed in the early 1900s (pre-World War II) • 1904 Europeans demonstrated use for detecting ships in fog • 1922 U.S. Navy Research Laboratory (NRL) detected wooden ship on Potomac River • 1930 NRL engineers detected an aircraft with simple radar system • world war II accelerated radar’s development • Radar had a significant impact militarily • Called “The Invention That Changed The World” in two books by Robert Buderi • radar’s has deep military roots • it continues to be important militarily • growing number of civil applications • objects often called ‘targets’ even civil applications
Active Remote Sensing • Active microwave (RADAR) • LIDAR • SONAR
Types of Radars • NonImaging radar • dopplerradar system • determine the speed by measuring frequency shift between transmitted and return microwave signal • Imaging radar • High spatial resolution • consists of a transmitter, a receiver, one or more antennas, GPS, computers
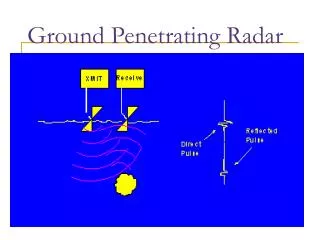
How Radars Work – The Short Answer • an electromagnetic wave is transmitted by the radar • some of the energy is scattered when it hits a distance • a small portion of the scattered energy is collected by the radar antenna
Background – Remote Sensing • Background – Global Climate Change • Radar Overview • Radar Basics • Ice Sheet Science • What Are We Doing? • How Are We Doing It?
Radars on A Variety of Platforms NASA DC-8 NASA P-3 • Twin-Otter UAV’s
Our Radars Radars covering frequencies from 7 MHz to 18 GHz High-frequency radars provide very fine resolution at the surface and progressing to coarser resolution with deeper sounding capabilities at lower frequencies.
Outline • Background – Remote Sensing • Background – Global Climate Change • Radar Overview • Radar Basics • Ice Sheet Science • What Are We Doing? • How Are We Doing It?
The Data Deluge Expect massive increases in amount of data being collected in several diverse fields over the next few years: • Astronomy - Massive sky surveys • Biology - Genome databases etc. • Earth Observing! • Digitisation of paper, film, tape records etc to create Digital Libraries, Museums . . . • Particle Physics - Large Hadron Collider • . . . 1PByte ~1000 TBytes ~ 1M GBytes ~ 1.4M CDs [Petabyte Terabyte Gigabyte]
Challenges of Processing Radar Imagery • Automated processing and extraction of high level information from radar imagery is challenging. • Noise is usually electromagnetic interference from other onboard electronics. • Low magnitude, faint, or non-existent bedrock reflections occur: • Specific radar settings • Rough surface/bed topography • Presence of water on top/internal to the ice sheet. • This produces gaps in the bedrock reflection layer which must be connected to construct an adjacent layer for the completion of ice thickness estimation.
Challenges of Processing Radar Imagery • Backscatter introduce clutter and contributes to regions of images incomprehensible. • In addition, bed topography varies from trace to trace due to rough bedrock interfaces from extended flight segments. • Lastly, a strong surface reflection can be repeated in an image, surface multiple due to energy reflecting off of the ice sheet surface and back again. • If there is a time difference between the first and second surface return, the surface layer will repeat in an image, at a lower magnitude with an identical shape.
Challenges of Processing Radar Imagery Column Pixel • Each measurement is called a radar trace, and consist of signals, representing energy due to time. The larger time correlates with deeper reflections. • In an image, a trace is an entire column of pixels, each pixel represents a depth. • Each row corresponds to a depth and time for a measurement, as the depth increases further down.