Download
1 / 25
250 likes | 400 Views
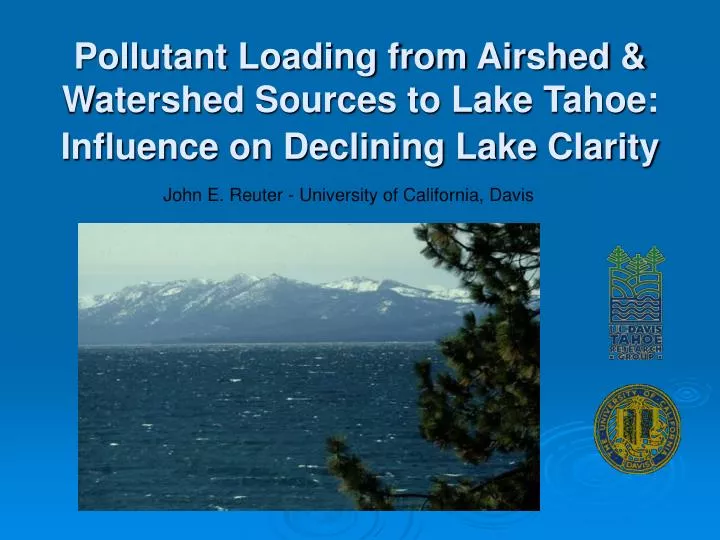
Pollutant Loading from Airshed & Watershed Sources to Lake Tahoe: Influence on Declining Lake Clarity. John E. Reuter - University of California, Davis. Presentation Topics. Lake Tahoe and overview of impacts Transport of toxics to lake

E N D
Pollutant Loading from Airshed & Watershed Sources to Lake Tahoe: Influence on Declining Lake Clarity John E. Reuter - University of California, Davis
Presentation Topics • Lake Tahoe and overview of impacts • Transport of toxics to lake • Atmospheric deposition, nutrient budget & nutrient limitation • Current research on nutrient and particle sources • Linkage to Tahoe TMDL
Features of Lake Tahoe • Subalpine, oligotrophic, low nutrients in soils • 800 km^2 drainage • 500 km^2 lake surface • 499 m max. depth • 650 yr hydraulic residence • 80% land managed by USFS • Urban-wildland interface
Lake Tahoe: A Changing Ecosystem • Significant portions are urbanized • Increased resident population • Millions of tourists • Peak VMT >1,000,000 miles/day • Loss of wetland and runoff infiltration • Extensive road network • Land disturbance - soil erosion • Air pollution
Changing Landscape has Lead to Following Lake Issues • Loss in transparency • Increased algal growth • Changes in biodiversity • Higher load of nutrients and fine-sediment • Wetland/riparian habitat loss • Invasion of non-native biota • Air quality impacts • Appearance of toxics (e.g. PCB, Hg, MTBE) • Significant effort on part of state and federal agencies, local government, universities and environmental consultants to address these and other issues
Transport of Toxics to Lake and Incorporation into Biota Air Pollution is Just Not a Local Issue
Regional Transport of Mercury Alan C. Heyvaert et al. (2000)
Air, water, snow & fish samples taken at Tahoe and nearby lake showed measurable levels of PCBs Low levels of contamination but mass balance suggests: a) atmospheric sources dominate b) out-of-basin transport Transport of Organic Toxics S. Datta, F. Matsumura et al. (1998)
Atmospheric Deposition, Nutrient Budget & Nutrient Limitation Influence on Long-term Decline of Lake Clarity
Unraveling Cause(s) for Declining Water Clarity • Nutrients stimulate algae • Fine-sediments directly reduces clarity (1-20 µm) • Progressive accumulation leads to long-term decline • Management strategy - P, N, sediment control • Evidence for possible recovery • TMDL, EIP & other plans are addressing load reduction
“Initial” Lake Tahoe Nutrient Budget Jassby et al. (1994), Reuter et al. (2000) Total-N Total-P Atmospheric Deposition 234 (59%) 12.4 (28%) Stream loading 82 (20%) 13.3 (31%) Direct runoff 23 (6%) 12.3 (28%) Groundwater 60 (15%) 4 (9%) Shore erosion 1 (<1%) 1.6 (4%) Total 400 43.6 • Strongly suggests importance of AD for nutrients • Little data on inorganic particle deposition (soils) • Size and low nutrient condition of Tahoe increases its importance • More work underway to improve initial estimate (ARB, DRI, UCD)
Long-term shift from N&P co-limitation to consistent P limitation Data strongly suggests that AD, with high N:P ratio is associated with this shift Fundamental change in lake ecosystem function AD-N very important in coastal oceans Another example of airshed-watershed interaction Change in Algal Response to Nutrients Goldman et al. (1993), Jassby et al. (1994)
Current Research on Nutrient and Particle Sources ‘Not So Elementary My Dear Watson’
Current Research is a Work in Progress • Sources of N, P and fine-sediment - local, regional and global • In-basin or out-of-basin: a key management question • The Lake Tahoe Air Quality Research Scoping Document (Cliff et al. 2000) identified need to look at: • Fires (controlled/wild) • Road dust • Vehicle exhaust • Residential heating • Upwind emissions • LTADS -> CARB and universities are addressing source
PM2.5 (µg/m3) based on 3 fire scenarios: a) Historical wildfire (12-16 ha) b) Hypothetical prescribed burn, 50-ha, Ward Valley c) Same as b, with 100-ha prescribed burn Significant implications for visibility and source for direct deposition LTAM Predicts Smoke PM2.5 forWildfire & Prescribed Burns S. Cliff & T. Cahill (2002)
Top of bar = Particulate N Bottom of bar = Gaseous N Aircraft Measurements of N & P in Forest Fire Smoke in and Around Tahoe Basin Q. Zhang et al. (2002) • TN - 5-6 x higher in forest fire smoke than clean Tahoe air, with a greater contribution by ON • P - 10 x higher in smoke plume; much less P in slightly smokey air • Bulk deposition measured at Tahoe 5-10 times during smoke period • Smoke can be nutrient source, but depends on transport and deposition
Aerosols at South Lake Tahoe:Evidence for the Role of Road Dust Cahill et al. (2003) • Continuous monitoring of 8 size modes (0.09-35 µm) in summer and winter with Drum Sampler at site downwind of Highway 50. Analysis for 32 elements done at 3 hr intervals. • Conclusions: •Hwy 50 major source of coarse particles (2.5-35 µm) • Particles >PM10 contain most P • Previous AQ studies did not focus on larger cuts • Hwy 50 also source of fine particles (0.09-0.26 µm) from diesels, smoking cars and fine ground road soil • Transport out over lake occurs each night • Data suggest that winter P is strong associated with road sanding/drying conditions while in summer values are more consistent day-to-day suggesting road dust from highway and near-highway soils • Contribution to whole-lake P budget now being evaluated
Linkage to Tahoe TMDL Total Daily Maximum Load Best Understood as Water Clarity Restoration Plan
Problem Statement • Numeric Target • Source Analysis • Linkage Analysis • Load Allocations • Margin of Safety • Implementation Plan Elements of a TMDL
% Nitrogen Reduction 100 90 80 70 60 50 40 30 20 10 0 0 10 20 30 % Sediment Reduction 40 50 60 70 80 90 100 Final Secchi Depth (m) 0 10 20 30 20- 25………Red 25.5-28…….Yellow 28.5-32.5…..Blue 33 & above..Purple 40 50 60 70 80 % Phosphorus Reduction 90 100 Conceptual Load Reduction Model • Informed by Clarity model • Multiple potential solutions Parameters are for illusrative purposes only
Example Load Reduction Alternatives A Urban (34%): U-2, U-6, U-14, U-26, U-56, U-78 Atmospheric (12 %): A-3, A-7, A19, A43 Stream Channels (20%): ST-10, ST-34, ST-43 Ground Water (12%): GW-2, GW-4, GW-18 Forested Areas (22%): FA-11, FA-23, FA-25 TOTAL REDUCTION = 15,000 kg tbd/yr C Urban (20%) Atmospheric (15%) Stream Channels (30%) Ground Water (25%) Forested Area (15%) TOTAL REDUCTION = 15,000 kg tbd/yr B Urban (20%) Atmospheric (25%) Stream Channels (25%) Ground Water (15%) Forested Areas (15%) TOTAL REDUCTION = 15,000 kg tbd/yr Parameters are for illustrative purposes only
Conclusion Science-Based Decision Making Stakeholder Driven