Download
1 / 45
450 likes | 470 Views
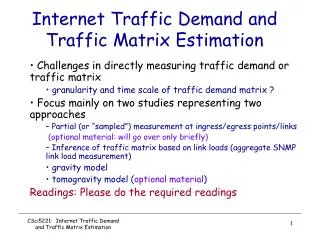
Explore the significance of characterizing internet traffic, measurement methodologies, flow characteristics, and file size distributions for effective network provisioning. Learn about monitoring tools and measurement studies to optimize network performance.

E N D
Internet Traffic Characterization Amogh Dhamdhere Amogh Dhamdhere
What is covered in this talk… • Why characterize Internet traffic ? • Measurement and analysis methodologies. • Measurement studies. • Variation of Internet traffic (time of day, day of week effects) • Packet level characteristics (packet sizes). • Flow level characteristics (Flow sizes, flow durations). • File size distributions. • Distribution by application. • Distribution by protocol. Amogh Dhamdhere
What is not covered… • Everything that will be covered in future presentations !! • Delay and loss measurements • TCP related measurements (TCP flavors etc) • Self similarity of Internet traffic • Flow measurements • Peer to peer traffic measurements Amogh Dhamdhere
Goals of this research.. • Observe Internet traffic characteristics. • Develop reasonable models to understand these characteristics. • Failure of traditional mathematical modeling techniques (e.g. Queueing theory). • Earlier models deal with issues which are non-critical from the practitioner’s point of view. • Attempt to close the void between theory and practice. Amogh Dhamdhere
Why Characterize Internet Traffic ? • Provisioning network resources (capacity, buffer, etc) • How should the network be provisioned to satisfy certain constraints. • Constraints may differ with the type of traffic. • E.g. Buffer provisioning • Current tools (eg SNMP) may not be sufficient • Analyzing network performance • TCP performance • Routing performance Amogh Dhamdhere
Why Characterize Internet Traffic ? • Obtain characteristic workloads for use in simulations • Typical packet sizes • Typical flow durations • Most commonly used TCP flavors • Important for ISPs to formulate policy decisions (Service Level Agreements) • Developing techniques to detect network anomalies e.g. Denial of Service attacks. • Verify ‘rule of thumb’ type design guidelines. Amogh Dhamdhere
Measurement Methodologies Objectives of a monitor: • Collection of detailed traffic statistics from heterogeneous network links. • Non-interference with the measured network (non-intrusiveness). • Obtaining a global view of the monitored network from a reasonable number of monitoring points. Types of monitor: • Active monitors • Passive monitors Amogh Dhamdhere
IPMON (Sprint) • Passive monitor for the Sprint backbone network. • Capable of monitoring links of capacities ranging from OC-3 to OC-48. • Uses an optical splitter on the monitored link. • Records packet traces including IP and TCP/UDP headers, timestamp. • Trace sanitizer. • Analysis component: • Flow statistics (start and end time of flows, flow sizes) • Protocol (TCP, UDP) and application (web, email, streaming) split of traffic. Amogh Dhamdhere
IPMON Amogh Dhamdhere
Other Projects • OC3MON (MCI) - Passive monitor designed for OC3 links (155 Mbps). • NetScope (AT&T) - A set of tools for traffic engineering in IP backbone networks. • Network Analysis Infrastructure (NAI) - Performance of vBNS (very high speed Backbone Network Service) and Abilene networks. • Some routers have built-in monitoring capabilities. • Netflow – Cisco routers. • Commercial tools • Niksun’s NetDetector and NikScout’s ATM Probes. Amogh Dhamdhere
Measurement Studies Wide Area Internet Traffic Patterns and Characteristics – Thompson, Miller, Wilder, MCI Telecommunications, 1997. • One of the first studies of commercial backbone traffic. • Used the OC3MON traffic monitor described earlier, at two locations on MCI’s commercial backbone. • Characterize traffic on timescales of 24hrs and 7 days in terms of traffic volume, flow volume, flow duration, packet sizes, traffic composition (by protocol, application). • Two links monitored. Domestic and International. Amogh Dhamdhere
MCI Study – Daily and weekly effects • Traffic volume shows a clear diurnal pattern, with traffic tripling from 06:00 through 12:00 noon EDT. • Traffic decreases by about 25% during the weekend. • The two directions of the monitored link are not symmetric. Amogh Dhamdhere
MCI Study – Asymmetry in packet sizes • Packet sizes are different in the two directions, and are roughly inversely proportional to each other. Amogh Dhamdhere
MCI Study – Packet size distributions • Packet size distributions are trimodal. • 40-44 bytes - TCP ACKs, control segments etc. • 552 or 576 bytes - Default MSS when MTU Discovery is not used is 512 or 536 bytes. • 1500 bytes MTU for Ethernet. Amogh Dhamdhere
MCI Study – International Link Traffic • International link traffic shows similar time of day, day of week effects. • Packet sizes in the two directions are asymmetric – Larger packets in the U.S. to U.K. direction. Amogh Dhamdhere
MCI Study – Protocol and Application Mix • Protocol composition • TCP dominates (95% of bytes, 90% packets, 75% flows) • UDP second (5% bytes, 10% packets, 20% flows) • ICMP most of the remaining. • Application composition • Web (75% bytes, 70% packets, 75% flows) • Other (may also be web-related) • DNS (1% bytes, 3% packets, 18%) • SMTP (5% bytes, 5% packets, 2% flows) • FTP (5% bytes, 3% packets, <1% flows) • NNTP (2% bytes, <1% packets, <1% flows) • Telnet (<1% bytes, 1% packets, <1% flows) Amogh Dhamdhere
Measurement Studies Trends in Wide Area IP Traffic Patterns – McReary, Claffy, CAIDA, 2000. • Data collected by the NAI project from May 1999 through March 2000 at the NASA Ames Internet Exchange. • Analysis of packet size distributions, protocol/application mix etc. • Show increasing trends in traffic from new (at that time) applications e.g. streaming media, online games, Peer to Peer (Napster). • No change in the overall trend in the TCP/UDP traffic ratio as compared to the analyses at MCI and CAIDA in 1998. Amogh Dhamdhere
CAIDA Study – Packet Size Distributions • Packet size distributions show same trimodal trend as previous results. Amogh Dhamdhere
CAIDA Study – Protocol and Application Mix • Protocol mix • TCP and UDP are still the most popular protocols, and in roughly the same proportions. • Application mix (TCP) • Web is still the most popular application • New applications like peer to peer file sharing (Napster) now appear in the list. (Napster at 5th position) • Application mix (UDP) • Streaming media (RealAudio) now comprises a substantial portion of total UDP traffic. • Online games (Half Life, EverQuest, Unreal, Quake 3) also have substantial share. Amogh Dhamdhere
CAIDA Study – Long Term Trends • The protocol mix of the traffic (TCP and UDP) does not change significantly over time. • Decline in the contribution of FTP to the overall traffic mix. • Possibly due to shift from active to passive mode FTP, because of an increase in packet filtering firewalls. • Alternate protocols for file transfer. • Decline in the fraction of RealAudio traffic. • RealAudio traffic has remained fairly constant, while other traffic has increased. • Decline in the fraction of game traffic Amogh Dhamdhere
CAIDA Study – Long Term Trends • Significant increase in peer to peer traffic (Napster) Amogh Dhamdhere
CAIDA Study – Short Term Trends • Email traffic increased significantly in November and early December, decreasing after December holidays. Amogh Dhamdhere
CAIDA Study – Short Term Trends • Online gaming shows day of week effects, with traffic nearly doubling over weekend periods. Amogh Dhamdhere
Measurement Studies Longitudinal study of Internet traffic from 1998-2001 – Fomenkov, Keys, Moore, Claffy, CAIDA, 2001. • Unique long term view of Internet traffic. • Multiple observation sites (20) • Four metrics of measured traffic • Number of bytes. • Number of packets. • Number of flows. • Number of source-destination pairs (port number and protocol fields ignored). This measures the number of Internet hosts communicating via the monitored link. Amogh Dhamdhere
Longitudinal Study • Bit and packet rates show diverse behavior • Some sites show sustained growth, some are constant and some fluctuate between growth and reduction. • No clear diurnal pattern in the measured traffic ! • No consistent long term growth – Refutes the notion that Internet traffic ic universally and rapidly increasing. • Usage patterns • Traffic composition varies significantly from site to site. • WWW traffic reached maximum between late 1999 and early 2000. • Has been constant or decreased since. • This could be due to the onset of noticeable amounts of P2P traffic. Amogh Dhamdhere
Longitudinal Study – Application Mix Amogh Dhamdhere
Measurement Studies Packet Level Traffic Measurements from the Sprint IP Backbone – Fraleigh, Moon, Lyles, et al. Sprint Labs, 2003 • Most recent (2001-2002) study of traffic on a commercial backbone link. • Analyses the impact of new applications (distributed file sharing, streaming media) • New results for end-to-end loss and delay performance of TCP connections. • Measurements of network delays in the backbone and U.S. transcontinental links. • Methodology – Uses the IPMON architecture described earlier. Amogh Dhamdhere
SPRINT Study – Traffic Load • Traffic load in bytes • SNMP is not able to capture the burstiness of the traffic at smaller timescales. • Most backbone links are utilized under 50%. Less than 10% of the backbone links experience utilization higher than 50% in any 5 min interval. • Noticeable peaks in traffic load are observed due to DoS attacks. • Traffic in a bidirectional link is asymmetric. • Many applications are inherently asymmetric. • Hot potato routing. Amogh Dhamdhere
SPRINT Study SNMP is not able to capture the burstiness of the traffic at smaller timescales. Amogh Dhamdhere
SPRINT Study – Application Mix • Application mix varies from link to link. • In most cases, web represents more than 40% of total traffic (As seen in previous studies) • However, on some links, the web contributes less than 20%, while P2P accounts for 80%. • Streaming applications are a stable component of the traffic. Amogh Dhamdhere
SPRINT Study - Flows • The number of flows and the traffic load are not necessarily correlated. i.e a large number of flows does not always mean a large traffic load. Amogh Dhamdhere
Measurement Studies – Flow level Understanding Internet Traffic Streams: Dragonflies and Tortoises – Brownlee, Claffy – CAIDA. • Results of flow level measurements from two links: OC3 link (Auckland) and OC12 link (UCSD) • Uses an extension of NeTraMet to monitor stream lifetimes. • Previous classifications of flows were on basis of size (packets or bytes) • Elephants (large transfers) • Mice (short transfers) • Propose alternate classification of TCP flows on basis of their lifetime. • Tortoises (long lasting transfers) • Dragonflies (short duration transfers) • Here flows are defined as sets of packets traveling in either direction between a pair of end-points. Amogh Dhamdhere
Dragonflies and Tortoises • Percentages of streams and bytes. • Long Running (LR) streams (>15 mins) account for about 1% of the streams. • Very Short streams (<2 sec) account for 40 – 70 % of streams, showing a diurnal pattern of variation. • At UCSD site, 50% of all bytes were in LR streams, while this fraction was 5% for Auckland. Most of these streams are non-web traffic. Amogh Dhamdhere
Short Streams – Streams lasting less than 15 mins • Lifetime distributions • 45% of streams have lifetimes less than 2 sec. • Distributions do not change rapidly over time. Amogh Dhamdhere
Short Streams – Streams lasting less than 15 mins • Byte size distributions • Short stream size distributions for UDP, non-web TCP and web TCP are considerably different. • Distributions are stable over long periods of time Amogh Dhamdhere
Tortoises – Streams lasting more than 15 mins • Bit rates • Longer duration LR streams are low-rate (interactive) or high rate (multimedia) with approximately equal frequency. • Medium duration LR streams tend to be high-rate. (file transfers) • UDP streams run at constant bit rates, but these rates may change in response to the application’s state (online games). Amogh Dhamdhere
Tortoises – Streams lasting more than 15 mins • LR stream lifetimes • LR stream lifetimes seem to follow a power law distribution. Amogh Dhamdhere
Measurement Studies – Flow level Internet Stream Size Distributions – Brownlee, Claffy, CAIDA 2002. • Measurements of • Per minute distributions of stream sizes in bytes for a period of one hour. • Two different types of traffic considered: Web traffic, and non-web TCP traffic. • Web streams • 87% under 1kB, 8% between 1 and 10 kB, 4.8% between 10 and 100 kB. • Non-web streams • 89% under 1kB, 7% between 1 and 10 kB, 1.5% between 10 and 100 kB. Amogh Dhamdhere
Internet Stream Size Distributions Amogh Dhamdhere
File Size Distributions The Structural cause of file size distributions – Downey, 2001. • A new model for the operations that create new files. • Files appear because of common operations. • Copying. • Translating and filtering. • Editing. • Using this, the distribution of file sizes can be predicted to be lognormal. • Start with a single file of size s*. • Select a file size s at random from the current distribution. • Create a new file with size fs and add to the distribution. (f is a factor chosen from some other distribution. • Hence size of nth file is sn = s* · f1 · f2 · f3…..fm • log(sn) = log(s*) + log(f1) + …. Amogh Dhamdhere
File Size Distributions • File sizes on web servers • Studies by Arlitt and Williamson claim file size match the Pareto model. • This may not be true !! • Some of the analyzed data sets better fit the lognormal model. • Traces of downloaded files. • Fits a hybrid model with lognormal distribution with a Pareto tail. • Two mode lognormal model is also a good match. • Summary – The distribution of file sizes is NOT heavy tailed ! • Implications on self-similarity of Internet traffic • Most explanations assume that distribution of file sizes is long-tailed. • Need to revise explanations of self-similarity. Amogh Dhamdhere
Non-commercial networks Some results from the abilene network during the duration of one week. • Application mix • Web traffic is much lower as compared to commercial backbone networks. • Email traffic is higher. • Measurement traffic amounts to 5% of all traffic !! • Protocol mix • TCP is still the most dominant (90% of bytes). • UDP accounts for 5%. • ICMP around 4%. • Numbers similar to that on commercial backbone links. Amogh Dhamdhere
Future Directions • Self-similarity – The need to verify assumptions. • Downey questioned the assumptions about file size distributions. • Inter-arrival time distributions. • Transfer length distributions. • Burst size distributions. • Dependence of traffic characteristics on TCP algorithms. • Measurement based forecasting of DoS attacks and flash crowds. • Real time monitoring of critical parameters. Use this characterization to automatically make decisions. • Provisioning. • Routing etc. Amogh Dhamdhere
Future Directions • Characterization of P2P traffic. • Previous measurement studies on P2P systems focused on node behavior, topology etc. • Need to better characterize the traffic generated by P2P applications. Amogh Dhamdhere
Thank You ! Amogh Dhamdhere