Download
1 / 28
280 likes | 294 Views
Explore how ensemble methods enhance predictive outcomes by merging multiple analyses in big data mining. Compare Boosting vs. Bagging techniques and learn to balance bias and variance for optimal model building. Dive into the replication problem, PIAAC study insights, and significant method variables. Understand the importance of gradual tuning in boosting and the impact of bias-variance trade-off in predictive modeling.

E N D
The Ensemble Method and Model Comparison for Predictive Modeling with Big Data SiyanGan, Pepperdine University Hyun Seo Lee, Azusa Pacific University Emily Brown, Azusa Pacific University Chong Ho Yu, Ph.D., D. Phil., Azusa Pacific University
Problem in replication • You cannot step into the same river twice! • Open Science Collaboration (OSC) (2015) found that a large portion of the replicated results were not as strong as the original reports in terms of significance (p values) and magnitude (effect sizes). • 97% of the original studies reported significant results (p < .05), but only 36% of the replicated studies yielded significant findings. • The average effect size of the replicated studies was only half of the initial studies (es= 0.197 vs. es= 0.403).
Ensemble Methods • Replication within the same data • The data set are separated into many subsets and multiple analyses are run. • In each run the model is refined by previous "training.” • Machine learning (based on Artificial intelligence): Learning from previous analysis • The Ensemble Method • Compares, complements, and combines multiple methods in the analysis. • Better predictive outcome than using just one analysis.
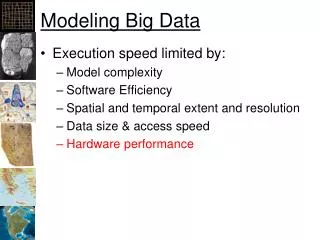
Ensemble Methods in Big Data Analytics/ Data Mining • Big data set are separated into many subsets and multiple analyses are run. • In each run the model is refined by previous "training.” • Machine learning (based on Artificial intelligence): Learning from previous analysis • The Ensemble Method: Merging multiple analyses • Compares, complements, and combines multiple methods in the analysis. • Better predictive outcome than using just one analysis.
Boosting vs. Bagging Boosting Bagging (not begging) • Creates a working model from the subsets of the original data set. • Adjusts weak models so they are combined to be a strong model. • (Bootstrap Aggregation) • Repeated multisets of additional training data from the original sample
Bagging as voting • Imagine that 1,000 analysts each one randomly draw a sub-sample from the big sample and then run an analysis. • The results must be diverse. • Now these 1,000 analysts meet together and vote. • “How many of us found Variable A as a crucial predictor? Please raise your hand.” And then move on to B, C…etc. • At the end we have a list of top 10 or Top 20.
Boosting as gradual tuning • Imagine that you are a cook. You put spices into the dish and taste it. • If it is not salty enough, you put more salt and pepper next time. • But next time it is too spicy, then you put less hot sauce. • You make gradual improvement every time until you have the final recipe. • Similarly, boosting is a gradual tuning process.
Bias and variance • The bias is quantified by the error which results from missing a target e.g, if an estimated mean is 3, but the actual population value is 3.5, then the bias value is 0.5. • The variance is the error which results from noise or random fluctuation. When the variance of a model is high, this model is considered unstable.
Bias and variance • A complicated model tends to have low bias but high variance. • Conversely, a simple model is more likely to have a higher bias and a lower variance. • We want a well-built, optimal model!
Bias and variance • Bagging • is utilized to decrease the variance • increases the size of these generated data and effectively minimizes the variance of prediction by decreasing the influence of extreme scores • Boosting • is used to weaken the bias in the process of building a predictive model. • increase the predictive accuracy
Debate on boosting and bagging • In theory, an ensemble method should suppress both bias and variance by merging overfitted and underfitted models. • Kotsiantis(2013) found that bagging tends to generate less heterogeneous models than boosting. • Fumera, Roli, and Serrau (2005) found that the misclassification rate of bagging has the same bias as a single bootstrap. When these overfitted models are averaged, the same bias is retained while the variance is cancelled out.
PIAAC Study • Programme for the International Assessment of Adult Competencies (PIAAC). • Developed by Organization for Economic and Cooperation and Development (OECD). • In 2014, PIAAC collected data from 33 participating nations (OECD, 2016). • U.S. adults were behind in all three test categories: • Literacy, numeracy, and problem solving in technology-rich environments. • Survey items included factors related to learning: • Readiness to learn, cultural engagement, political efficacy, and social trust.
Variables • The scores of literacy, numeracy, and technology-based problem-solving strongly correlated. Correlation matrix of literacy, numeracy, and problem-solving.
Variables • All three skills were combined into one component. • Composite score of literacy, numeracy, and problem-solving was treated as the dependent variable. Screen plot of PCA of literacy, numeracy, and problem solving.
Boosting and bagging in SAS proc hpforest data= <data>; target <dependent variable> / level= <binary, nominal, interval>; input <variable 1, variable 2, variable 3…etc.>/ level= <binary, nominal, ordinal, interval> ; run; PROC TREEBOOST DATA= <data>; INPUT <predictor 1, predictor 2…>/ LEVEL=; TARGET <dependent variable> /; ASSESS VALIDATA= <training/validation>; RUN;
Boosting and bagging in Enterprise Miner (EM) • The analyst can go one step further by creating an ensemble of models yielded from different modeling techniques. • The control point does not perform any computation; it simply stores the results for the ensemble node.
Model Comparison • Bagging and boosting outperformed than OLS regression in variance explained and error rate. • In training the bootstrap method yielded overfitted models because the R2 is unreasonably high. • The boosted tree model outperformed the bagging approach (higher variance explained and lower error). • Using R-square, RASE, and AAE
Final Boosted Tree Model for the USA sample • Top predictors: cultural engagement (voluntary work for non-profit organizations), social trust (other people take advantage of you), and readiness to learn (like learning new things).
Median smoothing plots Learning outcomes and social trust in the US sample.
Median smoothing plots Learning outcomes and readiness to learn in the US sample.
Median smoothing plots Learning outcomes and cultural engagement in the US sample.
Discussion • Method choice and model goodness should be assessed on a case-by-case basis • Run both bagging and boosting, then choose the best result according to the model comparison. • Big data analytics fixes the problem of hypothesis testing by using model building and data visualization • When the ensemble method,model comparison, and data visualization are employed side by side, interesting patterns and meaningful conclusions can be found from a big data set.
Contact Information • Name: Chong Ho Alex Yu • Company: Azusa Pacific University • City/State: Azusa CA • Phone: 480-567-4782 • Email: cyu@apu.edu


![Data Modeling [Comparison of data modeling techniques ]](https://cdn0.slideserve.com/205866/data-modeling-comparison-of-data-modeling-techniques-dt.jpg)


![Data Modeling [Comparison of data modeling techniques ]](https://cdn3.slideserve.com/6795343/data-modeling-comparison-of-data-modeling-techniques-dt.jpg)