Download
1 / 34
420 likes | 891 Views

E N D
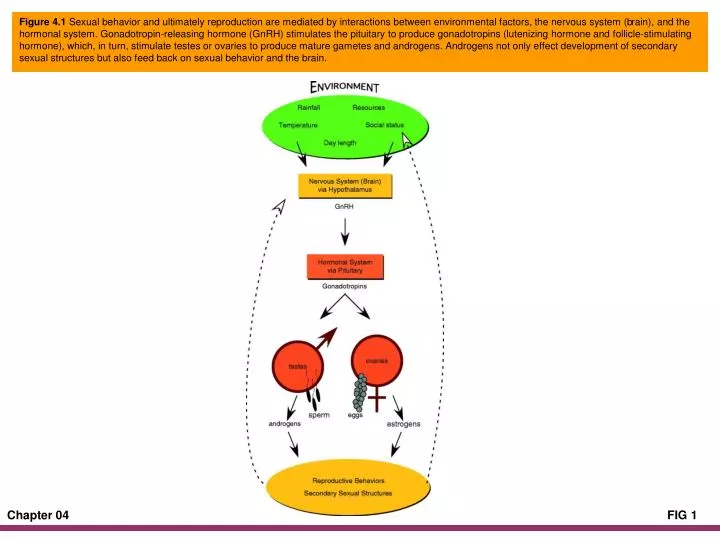
Figure 4.1 Sexual behavior and ultimately reproduction are mediated by interactions between environmental factors, the nervous system (brain), and the hormonal system. Gonadotropin-releasing hormone (GnRH) stimulates the pituitary to produce gonadotropins (lutenizing hormone and follicle-stimulating hormone), which, in turn, stimulate testes or ovaries to produce mature gametes and androgens. Androgens not only effect development of secondary sexual structures but also feed back on sexual behavior and the brain.
Figure 4.2 Spermatogenesis. Diagrammatic representation of a cross section through a seminiferous tubule in a reptile testis.
Figure 4.3 Structure of spermatozoan of a hylid frog. Only the base of the tail is shown, and the head of the sperm has been shortened. Redrawn from Costa et al., 2004.
Figure 4.4 Development of eggs in amphibians and reptiles. Fertilization occurs internally in all reptiles after eggs are ovulated into the oviducts. Fertilization occurs externally in most amphibians. Corpora lutea are often prominent in reptiles but rare in amphibians. Following production of the clutch, the process is repeated as unused ovarian follicles mobilize lipids for production of the subsequent clutch. Subsequent clutches may be produced within the same season or in the following season, depending upon species and the environment.
Figure 4.5 Oogenesis. Cross section through the ovary of the skink Carlia bicarinata, showing a corpus luteum (left) and a maturing follicle (right) with its ovum. Abbreviations: CL, corpus luteum; F, follicular cells; Tf, theca folliculi; Y, yolk; Zp, zona pellucida. (D. Schmidt)
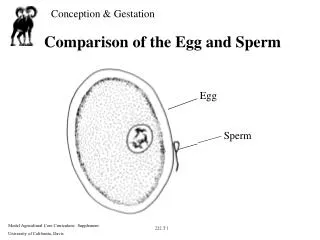
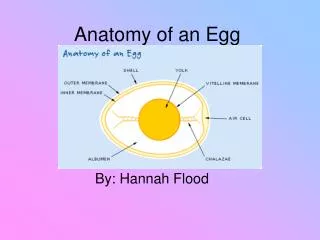
Figure 4.6 Comparison of anatomy of the anamniotic amphibian egg and the amniotic reptile egg.
Figure 4.7 Wall of the oviduct of the lizard Sceloporus woodi during shell production. Two proteinaceous fibers are emerging from the endometrial glands of the oviduct. Scale bar = 5 μm. Adapted from Palmer et al., 1993.
Figure 4.8 Positions used by frogs during amplexus. Adapted from Duellman and Trueb, 1986.
Figure 4.9 Diagrammatic representations of a spermatophore and a single spermatozoan of the salamander Ambystoma texanum. Sperm are located on the periphery of the cap of the spermatophore; the sperm heads point outward and tails are directed inward. Adapted from Kardong, 1992.
Figure 4.10 Nest of the Gladiator frog, Hypsiboas boans, from western Brazil. (J. P. Caldwell)
Figure 4.11 Nest of the saltwater crocodile (Crocodylus porosus). (R. Whitaker)
Figure 4.12 Indian python (Python molurus) brooding clutch of eggs. (M. T. O'Shea)
Figure 4.13 Effects of temperature on incubation period and developmental rate in eggs of the Australian skink Bassiana duperreryi. Developmental rate is the inverse of the observed incubation period divided by the shortest incubation period in the laboratory. Adapted from Shine and Harlow, 1996.
Figure 4.14 Spatial arrangement of hatchlings of Chrysemys picta in the nest during winter. From Breitenbach et al., 1984.
Figure 4.15 Sex ratios for four tortoise species (Gopherus polyphemus, G. agassizii, Testudo graeca, T. hermanni) raised at different incubation temperatures showing that males are produced at low developmental temperatures and females are produced at high developmental temperatures. Adapted from Burke et al., 1996.
Figure 4.16 Genetic and environmental factors affect embryo and hatchling phenotypes and can affect the sex of offspring in species that have temperature-dependent sex determination (TSD). Maternal effects cut across genetic and environmental effects, whereas paternal effects are only genetic.Adapted from Valenzuela, 2004.
Figure 4.17 Evolutionary hypotheses to explain TSD center on sex ratios, maternal effects, fecundity, and survival, none of which is mutually exclusive. Most hypotheses can be categorized by the fitness component that they address. Adapted from Valenzuela, 2004.
Figure 4.18 Offspring sex ratios differ in offspring produced in the first clutch of the season for Jacky Dragons in Australia in response to differing operational sex ratios (OSR) in experimental arenas of the mother. The response is exactly the opposite from what theory predicts. In successive clutches (2–3) sex ratios did not differ as a result of varying OSR, but the sex ratio of hatchlings was biased toward females. Adapted from Warner and Shine, 2007.
Figure 4.19 Annual variation in the trade-off between number of eggs and size of eggs in Lacerta agilis. The influence of body size on clutch size has been removed by expressing clutch size as residuals from the common regression. Adapted from Olsson and Shine, 1997.
Figure 4.20 Species and populations of Sceloporus lizards with variable clutch size have relatively massive clutches of eggs at any given body size when compared with Anolis lizards that have fixed clutch sizes of a single egg. In addition, clutch mass increases linearly with body size in Anolis but exponentially in Sceloporus. Adapted from Andrews and Rand, 1974. Refer to the original paper for species identifications.
Figure 4.21 Variation in the size of the pelvic opening of turtles and width of eggs associated with increasing body size in three species of emydid turtles.Adapted from Congdon and Gibbons, 1987.
Figure 4.22 Schematic diagrams of sex steroid production in relation to gametogenic cycle of a spring-breeding temperate-zone reptile. Steroid levels match the peaks of gametogenesis; androgen production begins simultaneously with spermiogenesis and continues until the testes regress; estrogen production occurs during final maturation of ovarian follicles, stopping at their maturation and ovulation. Corpora lutea produce progesterone, which continues while ova remain in the oviducts; production declines and corpora lutea degenerate with egg-laying, but in viviparous taxa, progesterone is produced throughout pregnancy. Adapted from Whittier and Crews, 1987.
Figure 4.23 Hybridogenesis in the frog Pelophylax [Rana] esculenta. Two general breeding systems (LE and RE) exist involving sexual and unisexual species, with considerable variation within each. At three localities in Denmark, southern Sweden, and northern Germany, all-hybrid populations of P. esculenta occur in the absence of sexual species. Because the male-determining "y" factor is on the L genome, hybridization can and does produce male hybrids. In the RE system, male hybrids (LyRx) are more successful than female hybrids (LxRx) in reproducing with P. ridibunda, resulting in female hybrids being less common. Hybrid triploids are produced in some populations when a P. lessonae male (LL) fertilizes a P. esculenta (LR) egg.
Figure 4.24 The cost (hybrid load) to hybridogenesis in Pelophylax [Rana] esculenta is high, with about 63% of offspring produced in all-hybrid populations dying before or during metamorphosis (Christiansen et al., 2005). Aneuploidy occurs when the ploidy level is not a multiple of the haploid number of chromosomes for the species.
Figure 4.25 Four sexual species of Ambystoma from which unisexual Ambystoma"steal" genomes. From left to right, A. jeffersonianum, A. tigrinum, A. texanum, and A. laterale. (J. P. Bogart).
Figure 4.26 Kleptogenesis occurs in salamanders of the Ambystoma laterale–jeffersonianum complex. mtDNA has persisted unchanged since the hybrid origin of unisexual populations in the Pliocene, but unisexuals pick up and use genomes of sexual species each time they breed yet do not pass those genomes on from generation to generation. In effect, they are "stealing" genes adapted to local conditions from sexual males.
Figure 4.27 Skin-graft test for genetic similarity in the unisexual Aspidoscelis uniparens (left) and the bisexual A. tigris (right). Because of the clonal nature of A. uniparens, all 9 grafts were accepted; in contrast, all 10 grafts were rejected in A. tigris. Adapted from Cuellar, 1976.
Figure 4.28 Genealogy of the parthenogenetic teiid and gymnophthalmid lizards. The lines originating on species names denote the parents that hybridized to create the parthenoforms/parthenogens (black circles). In many cases, a single hybridization event produced diploid parthenoforms, in others, a single hybridization produced triploid parthenoforms, and in yet others, backcrosses between a parthenoforms and a sexual species produced triploid parthenoforms. Parthenogenesis has arisen independently in the Teioidea multiple times. Adapted from Reeder et al., 2002.
Figure 4.29 Relationship between hormone production, follicle development, and behavior in parthenogenetic whiptail lizards (Aspidoscelis) during pseudocopulation. Adapted from Crews and Moore, 1993.
Figure 4.30 Hypothetical growth rates for populations of parthenogenetic and sexually reproducing Aspidoscelis based on laboratory data on A. exsanguis and assuming no mortality. The starting point on the graph represents hatching of one egg. Because 50% (males) of the sexually reproducing species do not produce eggs, population size of the parthenogenetic population is more than double that of the sexual species after only 3 years. Adapted from Cole, 1984.
Figure 4.31 Age distribution patterns of a snake, lizard, and tortoise population. Point-in-time patterns differ between a moderate-lived snake, Agkistrodon contortrix; a short-lived lizard, Basiliscus basiliscus; and a long-lived tortoise, Geochelone gigantea. The bars denote the percent (of total population) of males or females present in each age class; open bars, unsexed individuals; shaded bars, females; solid bars, males. Adapted from Vial et al., 1977; Van Devender, 1982; and Bourn and Coe, 1978, respectively.
Figure 4.32 Top: Hypothetical survivorship curves for animal populations (see text). Bottom: Representative survivorship curves for amphibians and reptiles with short life spans (left) and long life spans (right). Although the lower graphs are superficially similar, note the great difference in age scale.Data from the following: Amphibians—Pj, Hairston, 1983; Rc, Briggs and Storm, 1970; Reptiles—Cc, Brown and Parker, 1984; Ts, Frazer et al., 1990; Us, Tinkle, 1967.
Figure 4.33 Prim diagram showing axes of variation in life history traits of lizards. Adapted from Dunham et al., 1988, with taxonomy for the Iguania updated.
Figure 4.34 Prim diagram showing axes of variation in life history traits of snakes. Only three snake families are included, so the analysis must be considered preliminary. Nevertheless, coadapted sets of life history traits appear evident. Adapted from Dunham et al., 1988, with errors corrected.