Download
1 / 30
320 likes | 573 Views
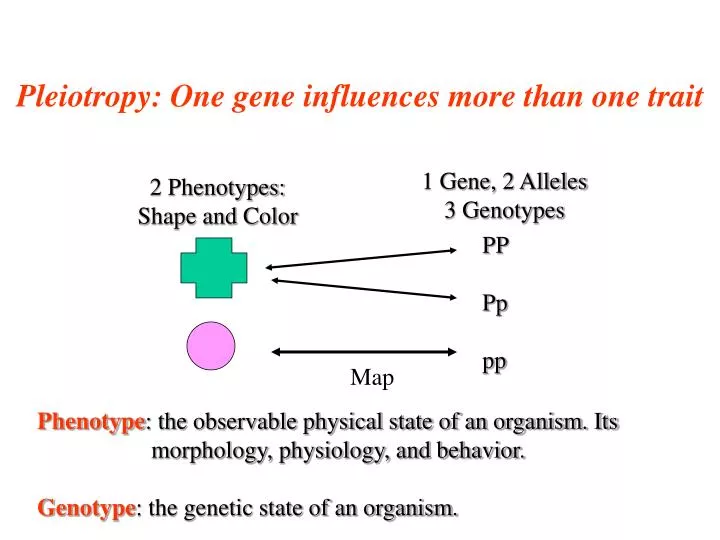
Pleiotropy: One gene influences more than one trait. 1 Gene, 2 Alleles 3 Genotypes. 2 Phenotypes: Shape and Color. PP Pp pp. Map. Phenotype : the observable physical state of an organism. Its morphology, physiology, and behavior.

E N D
Pleiotropy: One gene influences more than one trait 1 Gene, 2 Alleles 3 Genotypes 2 Phenotypes: Shape and Color PP Pp pp Map Phenotype: the observable physical state of an organism. Its morphology, physiology, and behavior. Genotype: the genetic state of an organism.
The Reason for Mendel’s Success Mendel discovered the MAP from Phenotype to Genotype because, for all 7 of Mendel’s traits in peas, the MAP was SIMPLE: 2 Phenotypes 3 Genotypes Homozygote YY Dominant Yy Heterozygote Recessive yy Homozygote Map indirectly Inferred genes directly Observed traits
Pure-breeding Parents with 1trait X X F1 F2 9 3 4
Epistasis for Coat Color in the Laborador Retriever: Epistasis:Two (or more) genes interact to cause one phenotype.
With Epistasis the Map from Genotype to Phenotype is COMPLEX Complex Map of Coat Color Trait to Multi-Gene Genotypes 9 Genotypes 3 Phenotypes BBEE BBEe BbEE BbEe bbEE bbEe BBee Bbee bbee
Epistasis = Gene B’s Effect on phenotype, v, changes with the genotype at a Different Locus, E: bb BB bb BB Effect of B is Large +0.25 Phenotypic Effect of B Effect of B is Small 0.00 EE ee Background Genotype at the E locus
For most traits, the ENVIRONMENT also Affects the MAP between Phenotype and Genotype 3 Phenotypes3 Environments 1 Genotype Poor Nutrition Average Nutrition CC Excess Nutrition This variation in phenotype is caused by variation in the environment and NOT by variation in genotype
For Mendel there was No Effect of Environment: map of Genotype to Phenotype was constant so that Phenotypic Variation was caused byGenotypic Variation YY Yy Phenotype: Seed Color yy Cold Temperate Hot Environment Each line on this graph is called a “Norm of Reaction”:: The range of phenotypes produced by ONE genotype when that genotype is reared across a series of different environments.
Most traits are affected by the Environment: which changes the Relationship of Genotype to Phenotype CC Phenotype: Size Poor Average Excess Environment The line on this graph is the “Norm of Reaction” for genotype CC: ONE genotype-THREE phenotypes
For most traits, the ENVIRONMENT Affects the MAP between Phenotype and Genotype 3 Phenotypes3 Environments 3 Genotypes Excess Cc Poor Poor Average CC Excess cc Excess The Environment makes the MAP between Phenotype and Genotype Many to Many instead of One to One.
Excess CcDD Poor Poor Average CCDd Excess ccdd Excess Gene action makes the MAP between Phenotype and Genotype Many to Many instead of One to One: Pleiotropy: one gene affects two or more traits. Epistasis: two or more genes affect one trait.
Two phenotypes of thebarnacle Chthamalus anisopoma Bent morph Straight Morph Bent morph - more resistant to snail predation, but less fecund Straight Morph – less resistant to snail predation but more fecund Trade-off !! The predatory snail Acanthina angelica
For most traits, there are effects of Environment: which change the Relationship of Genotype to Phenotype Phenotype: Shell Shape Without With Environment
Temperature-dependent sex determination Barber’s Map Turtle, Graptemys barbouri Photo: Steven Freedberg Adult Male Adult Female <28.5 °C >29.0 °C Environment of Egg determines Sex of the Turtle!
For Mendel, there was no effect of other Genes = Relationship of Genotype to Phenotype was Constant YY Yy Phenotype: Seed Color yy ww Ww WW Genetic Background at Another Gene
For Mendel, there was no effect of Environment = Relationship of Genotype to Phenotype was Constant YY Yy Phenotype: Seed Color yy cold intermediate hot Environments
For most traits, there are Pleiotropy, Epistasis and Environmental Effects on Phenotype Hot Environment Cold Environment
Effects of Environment and Epistasis and Pleiotropy greatly complicate Mapping of Genotype onto Phenotype • Different Phenotypes do not necessarily indicate Different Genotypes. • Similar Phenotypes do not necessarily indicate Similar Genotypes. • Environment and Epistasis and Pleiotropymake the MAP between Genotype and Phenotype Many-to-Many
How do we study a Many-to-ManyMap of Genotype and Phenotype? • We want to know “How much variation in a phenotype is caused by genetic differences among individuals?” (“nature”) • We want to know “How much variation in a phenotype is caused by environmental differences among individuals?” (“nurture”) • What are the environmental vs genetic causes of the differences in morphology, behavior, and physiology among individuals.
Hot: A Population with Phenotypic Variation among its Members Temperate Did Different Environments Cause these differences in size? Cold: AA AA AA Did Different Genotypes Cause these differences in size? Aa Aa Aa aa aa aa
Controlled Breeding Experiments • Make crosses between different individuals and obtain offspring. • Measure the morphology, behavior, physiology of each offspring. • Estimate the genetic causes of the offspring variation by measuring the “degree of resemblance” among genetic relatives. • Genetic Relatives: (1) Parent-Offspring, (2) Brother-Sister, (3) Half-Siblings (same father, different mothers).
Heredity is the Cause of Resemblance between Genetic Relatives • Different kinds of relatives may share more or less phenotypic resemblance. • Diploid Genetic Relatives: (1) Parent-Offspring: share ½ of their genes. (2) Brother-Sister: share ½ of their genes. (3) Half-Siblings (same father, different mothers): share ¼ of their genes.
Non-Genetic Causes of Resemblance among Genetic Relatives • Similar environments: Genetic relatives often grow up in similar environments and individuals reared in the same environment may be more similar to one another than individuals reared in different environments. • Maternal Effects: Mother is a “special environment,” she provides both genes and nutritional environment. In mammals, these effects begin in utero.
In nature, the MATERNAL ENVIRONMENT Affects the MAP between Phenotype and Genotype 1 Phenotype1 MOM 2 Genotypes Cc cc Siblings are Similar Genetically Siblings are Similar Environmentally (through mother)
1 1 x 2 3 Paternal Half-Sibs 4 5 6 2 x Half-sibs Of Male 2 Half-sibs Of Male 1 Difference? Resemblance? Resemblance?
Half-sib Breeding Design 10 2 1 1 3 28 x x x 4 29 2 3 30 5 E1 E2 E3
1 2 10 1 3 28 x x x 29 2 4 30 5 3 Half-sib Breeding Design: Genetic Effect = Column Differences E1 E2 E3
1 2 10 1 3 28 x x x 29 2 4 30 5 3 Half-sib Breeding Design: Environmental Effect = Row Differences E1 E2 E3
1 2 10 1 3 28 x x x 29 2 4 30 5 3 Half-sib Breeding Design: Environmental AND Genetic Effects E1 E2 E3
Difficulties with Human Genetics • Cannot impose breeding designs on human population. Therefore cannot separate non-genetic maternal effects from genetic effects. • Cannot rear offspring of same parents in different environments: Thereforecannot separate non-genetic environmental effects from genetic effects. • Debate over “Nature vs Nurture” cannot be experimentally resolved in humans.