Download
1 / 23
230 likes | 241 Views
Discover the growth trends and segmentation results shaping the airline industry since 2003, including revenue, capacity, and profit insights. Learn how value airlines are outpacing network carriers, and key factors driving profitability.

E N D
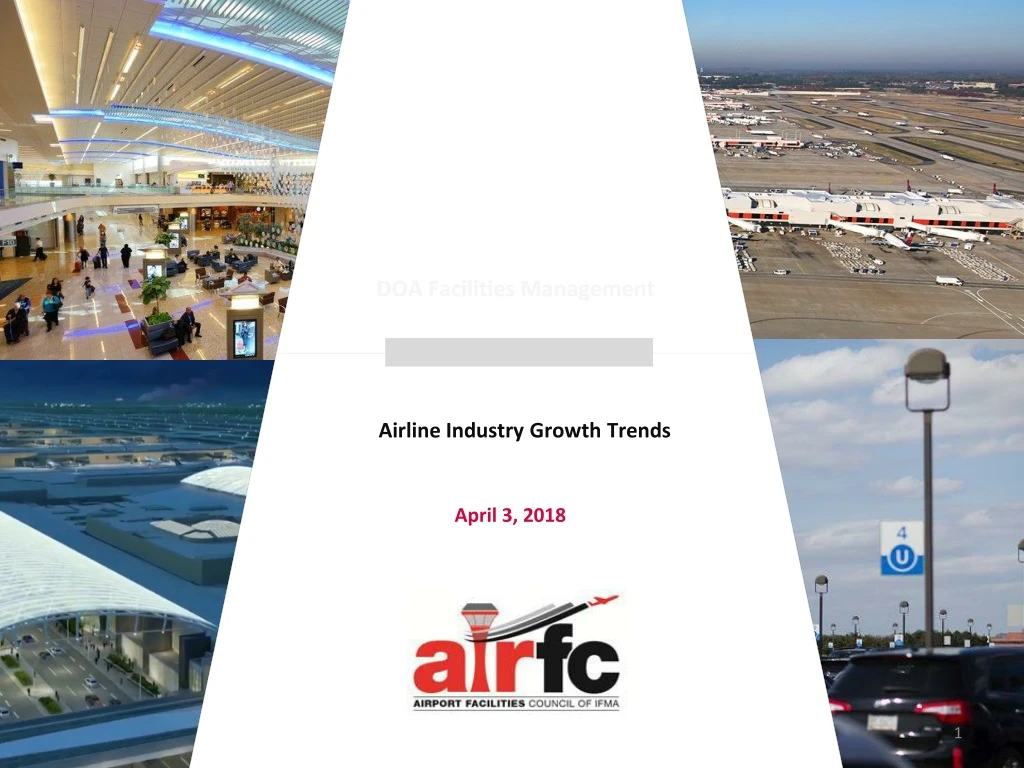
DOA Facilities Management Airline Industry Growth Trends April 3, 2018
World Growth Picture Steadily Increasing Demand Driving Higher Capacity, Seats & Revenue
Overview Since 2003 U.S. Airline Revenue Has Increased at a CAGR of 4.5% versus GDP of 3.8%
Airline Industry Outgrowing GDP Domestically Lower Fuel Prices and Better Management of Capacity Have Lead to Increased Profits
Value Airlines Growing Faster Than Network Airlines Value Airlines Are Adding Routes and Seats to Increase Revenue and Market Share
Network Airlines Operating Revenue Performance Network Carriers Increased Operating Revenue by $1.7 Billion for 6.5% Growth in 2017
Value Airlines Operating Revenue Performance Value Carriers Increased Operating Revenue by $736 Million for 9% Growth in 2017
How do the airlines make their money? Balancing these 5 factors enables the airlines to optimize income far better than cutting rates on landing fees or asking for a bigger cut of non-aeronautical revenue
Efficient management means leveraging the right tools? Airport non-aeronautical revenues play a small part in making airlines profitable
The fundamental management principles are the same Whether domestic or international flights the math works in a consistent manner
Because “Value” Airlines Have Cheaper Seats Yield plays a smaller role in profitability than you see in network airlines; fees and capacity become bigger leverage points for “Value” Airlines
International Flights Display a Different Paradigm for Value Airlines Value Airlines must manage “yield” harder to be successful on International Flights
Capacity Management by Airline The larger airlines are buying fewer planes while smaller airlines are investing heavier in more flights
Steady smooth ride seeing rough ride since 2014 Despite 38% increase from 2009-2014 passenger yield fell 12.5% from 2014-16 reaching low of 13.4 cents in 2017 versus 15.5 cents in 2014
Load Factor Continues at all time highs Airport support services in security and HVAC have to be at their best with high load factors like these
Load Factor Continues at all time highs High load factors mean airport have to bring their “A” game everyday
The importance of baggage Baggage fees are a very big deal for some airlines
Fuel Cost Fuel Cost increases have place pressure on rates
Labor Cost Labor cost were going up before tax law changes so we can expect more of same
Conclusions If you sense your airport is already “maxxed-out” now would be the time to re-do your Master Plan and begin planning to expand your facilities