Download
1 / 17
180 likes | 363 Views
Flood Inundation Mapping A New Way of Looking at Flooding. Diane Cooper Hydrologic Services Program Manager NWS - Southern Region Headquarters November 7, 2007. Today’s Topics. History of NWS Flood Severity Inundation Mapping How Standards for the Maps were identified.

E N D
Flood Inundation Mapping A New Way of Looking at Flooding Diane Cooper Hydrologic Services Program Manager NWS - Southern Region Headquarters November 7, 2007
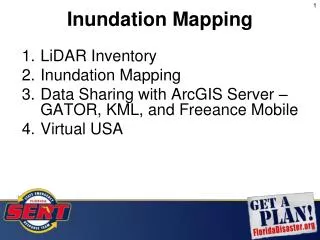
Today’s Topics • History of NWS Flood Severity Inundation Mapping • How Standards for the Maps were identified. • Online Demonstration • Funding for the project.
Advanced Hydrologic Prediction Services (AHPS) Objectives More precise forecasts at many time-scales Information to make risk based decisions Easy product access Visually oriented products
Data Currently Available for All AHPS Points • 3-tier, impact based, flood severity scale of minor, moderate, and major flooding categories. • Historical Crests information. Scroll down • Low Water Records. • Flood Impacts at particular stages. http://www.weather.gov/ahps/
Customers are telling us they…. • are familiar with NWS flood severity categories • find them useful • do not want changes to the existing flood severity indices • BUT…..they need a more intuitive way to communicate a persons Risk from a Flood. Hence…..Flood Inundation graphics (maps)
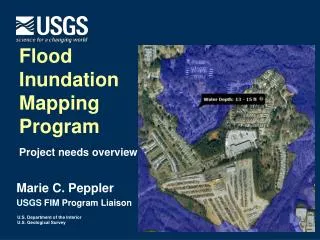
We “add” an overlay to existing base maps Graphical Flood Impact Information A 2-Dimensional Way to depict the 3-Dimensional (real life) impact • Partnering with NC Floodplain Mapping Program Office, FEMA, and USGS to develop prototype user-requested graphics to better convey flood threat
How Can this “New Way” of Displaying Information Help Decision Makers? • Provides a one stop shop for Emergency Managers, Fire, Police and General public to better understand the impact of a flood. • Those individuals can make quicker and more informed decisions of : • where to close roads, • where to evacuate, • where to sandbag • for contingency planning or in • the heat of the battle. "The problem for our emergency responders during flooding is that we rush over our floodplain maps but they are basically a 100 year storm event that rarely informs the expected flooding from a particular storm event." Floodplain Manager , Baltimore Area
Demonstration of Web Page Goldsboro NC
What about FEMA’s Map Mod Program? • FEMA is updating their FIRM’s( FEMA Flood Insurance Rate Maps) with a goal of: • Producing flood hazard layer in a seamless, county-wide GIS format that still provides flood severity information based on the probability of occurrence for a particular flood. • Providing maps and data in digital format (DFIRM) in adherence to established GIS Data Capture Standards New DFIRMS, which incorporated any updated modeling. Legacy FIRMS originally developed 30+ years ago. http://www.fema.gov/plan/prevent/fhm/mm_main.shtm
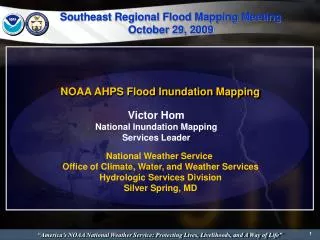
NOAA and FEMA PartnershipPartnering to Communicate Flood Risk Floods are a National Issue • FEMA providing updated Digital Flood Insurance Risk Maps (DFIRMS) • NWS developing inundation maps toshow the potential area covered by flood waters at a given stage/flow • They have identified ways to leverage each others ongoing activities and develop map inundation libraries at NWS service locations. Goal provide maps that not only convey flood risk but also flood severity and damage impacts Subcommittee on Hydrology Newsletter; Volume 1, Issue 2, March 2007 http://acwi.gov/hydrology/index.html
Other Partners Involved • USGS (provides the real-time and historical Gage information.) • Corps of Engineers (mainly involved with Map Mod and the modeling component.) • State and Local Communities (Assisting in Securing Funds and identifying potential locations) • Water Shed Concepts through EarthData International (company that has been contract to identify the map guidelines and is producing the NWS component of the project.)
Partnering to Reduce Costs and Improve Efficiency Efficiency goes up Costs go down • Cost per county average for updating FIS and maps: ~$300 - 400 K • Additional cost to complete one inundation map library as part of the FIS: $5 – 6 K (~1-2% cost increase) • Cost doubles and time increases if inundation map library is created after FIS is completed: $11 - 12K • Developing inundation libraries in conjunction with FIS yields significant user benefit for small incremental cost.
What It Takes To Produce The Inundation Maps • NWS Flood Severity Inundation Mapping Standards and Methodologies Contract #EA 133C-05-CQ-1051 Task Order #2) • Provides information including: • Standards for topographic and base data • Vertical Datums • Hydraulic modeling methods • Map Scales and layout
Mapped Locations and Short Term Activities. October 2007 • 17 Sites near Raleigh, NC. (Hurricane Floyd Funding) • Summer 2008 • 35 NWS Southern Region forecast points in 4 Gulf Coast States (Hurricane Katrina Funding)
How Can We Expand to More Locations? • Hone in on Future FEMA Map Modernization Areas • Look for opportunities with Corps of Engineers downstream study areas • Identify areas of ongoing or planned Coastal Areas and Dynamic Modeling studies • Engage Local and State partners to identify higher profile locations an provide financial support for the project Once the Hydrologic and Hydraulic modeling is complete it is an extra 3 to 6K to produce these graphics for NWS AHPS.
Recent Media Coverage • One minute Weather Channel Clip
Who Can I Contact To Learn More Brian Boyd, NWS – Morristown TN Brian.Boyd@noaa.gov Jason Elliott, NWS – Huntsville, ALJason.Elliott@noaa.gov James LaRosa, NWS – Nashville, TNJames.Larosa@noaa.gov Gene Rench, NWS – Memphis, TNGene.Rench@noaa.gov Dave Reed NWS – LMRFC Dave.Reed@noaa.gov Ben Weiger, NWS – Southern Region HQBen.Weiger@noaa.gov Diane Cooper, NWS –Southern Region HQDiane.Cooper@noaa.gov Victor Hom, NWS - HQ Victor.Hom@noaa.gov