Download
1 / 38
380 likes | 497 Views
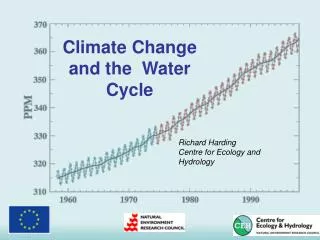
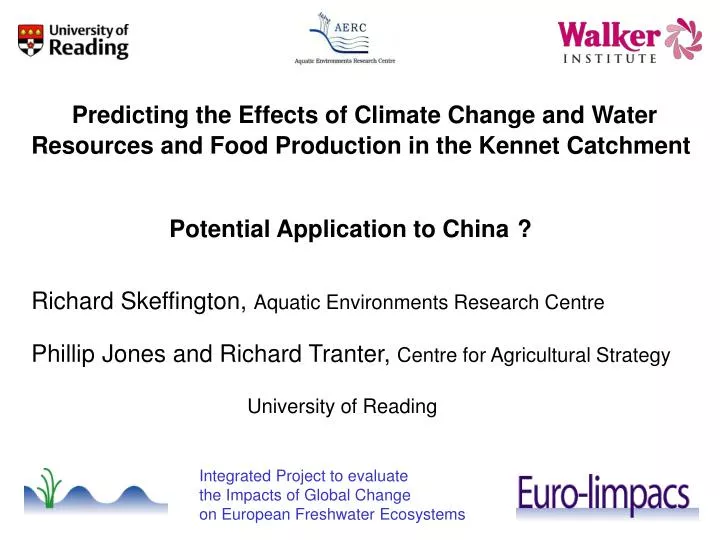
Predicting the Effects of Climate Change and Water Resources and Food Production in the Kennet Catchment. Potential Application to China. ?. Richard Skeffington, Aquatic Environments Research Centre Phillip Jones and Richard Tranter, Centre for Agricultural Strategy. University of Reading.

E N D
Predicting the Effects of Climate Change and Water Resources and Food Production in the Kennet Catchment Potential Application to China ? Richard Skeffington, Aquatic Environments Research Centre Phillip Jones and Richard Tranter, Centre for Agricultural Strategy University of Reading Integrated Project to evaluate the Impacts of Global Change on European Freshwater Ecosystems
The Kennet Catchment 1137 km2 Geology: chalk with clays at the East end Maximum altitude 297m above sea level Mean annual rainfall (1961-90): 759 mm Mean annual runoff (1961-90): 299 mm Theale
Kennet Agriculture Largely arable
Kennet Agriculture 2 Largely arable and livestock production
Kennet Land Use It is probably not very like China! There are some urban areas (this is Reading)
Problems on the Kennet 1. A low flow problem – the upper reaches can almost dry up in a dry summer 2. A (potential) nitrate problem – increasing concentrations Photo: Helen Jarvie
Modelling Agricultural Change CLIMATE CHANGE Change in river flows and composition Change in agriculture in catchment Changes in world agriculture Is it possible to model these outcomes? Changes in crop prices and demand …with any credibility? SOCIOECONOMIC CHANGE: population, global trade policies etc
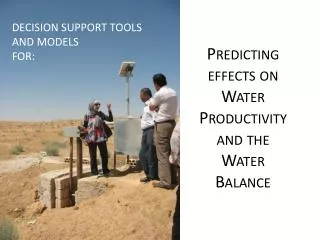
Predicting the effect of climate change on water resources and foodproduction Modelling land use impacts
Overview The socio-economic change scenarios IPCC SRES futures UKCIP refinements for UK BLS world food trade model The climate change scenarios HadCM3 projections The economic/land use model (CLUAM)
Autonomy National Enterprise Local Stewardship Consumerism Community Conventional Development World Markets Global Sustainability Interdependence The SRES storylines • Scenarios selected were: • A2 – low globalisation/market based solutions • B2 – low globalisation/sustainability led
Climate change scenarios • AOGCM HadCM3 (UK Hadley Centre’s1 third generation coupled Atmosphere-Ocean Global Circulation Model) • This used with the A2 & B2 SRES scenarios to project to 2100 • Our modelling scenarios sample 2020 and 2050 1 Hadley Centre for Climate Prediction and Research (part of UK Meteorological Office)
Basic Linked System (BLS) -1- • International Institute for Applied Systems Analysis (IIASA) • Framework for analysing the world food trade system • The BLS is an applied general equilibrium (AGE) model system • All economic activities are represented • 34 national and/or regional geographical components • 18 eighteen single-country national models • 2 region model • 14 country groupings
Basic Linked System (BLS) -2- • Market clearance (production and uses must balance) • The model is recursively dynamic, ie, working in annual steps • For given prices calculate Global net exports and imports • Check market clearance for each commodity • Revise prices. When markets are balanced, accept prices as world market solution for year and proceed to next year • This process is repeated until the world markets are simultaneously cleared in all commodities
BLS outputs • Production levels (volumes) • Market prices • Technology change (yields) LUAM also requires climate-driven yield changes
Climate induced yield changes • Two stage process: • Meta analysis of existing data on UK-specific crop yield changes due to climate change • Decisions on where crops would not grow due to climate limit
The CLUAM • An LP model of England & Wales agriculture • Range of major land using agricultural enterprises included • Outputs (revenue) • Inputs (incur costs) • Land base partitioned by CEH Land Classification system • Model objective maximize gross margin, • Subject to various constraints
Modelling Agricultural Change CLIMATE CHANGE Change in river flows and composition Change in agriculture in catchment Changes in world agriculture Changes in crop prices and demand SOCIOECONOMIC CHANGE: population, global trade policies etc
Downscaling in Space and Time The INCA-N model for predicting nitrate and flow works on a daily time step & requires daily temperature, rainfall and evapotranspiration. This work has used the UK Climate Impacts Programme (UKCIP02) Scenarios, derived as follows. SRES Scenarios (4 future climates, including A2 and B2) “Experiments” run by the Hadley Centre HadCM3 c.300 km grid HadAM3H c.120 km grid HadRM3 c.50 km grid European Model Monthly Time Step Global Models
More Downscaling HadRM3 c.50 km grid Monthly Kennet Catchment 5 km grid, Daily EARWIG Environment Agency Rainfall and Weather Impacts Generator • Stochastic “weather generator” giving daily values for: • Rainfall • Potential evapotranspiration (Penman –MORECS or FAO) • Min and Max temperatures (and others) Actual evapotranspiration estimated by a simple spreadsheet model constrained by soil water deficit.
EARWIG: Mean Monthly Temperatures Annual means: Base (1961-90) 9.2 C 2020 10.2 C 2050 B2 11.0 C 2050 A2 11.3 C
EARWIG: Mean Monthly Rainfall Annual Totals: Base 759 mm 2020s 787 mm 2050s 757 mm
. Each sub-catchment has 6 land uses: How does INCA work? Urban; Forest; Arable + Oilseeds; Grassland; Unfertilised; Not covered by CLUAM. Catchment divided into sub-catchments .
Hydrological Model P AET Quick flow Soil Quick Throughflow Groundwater Groundwater flow Land Cell: Hydrological Model Quick flow Abstraction (e.g. for water supply)
INCA-N Soil Processes Ammonium + Ammonium + Ammonium + Ammonium + Ammonium + Ammonium + Nitrogen Nitrogen Nitrogen Nitrate fertiliser Nitrate fertiliser Nitrate fertiliser Nitrate deposition Nitrate deposition Nitrate deposition Fixation Fixation Fixation Urban waste Urban waste Urban waste to River to River to River Nitrate Nitrate Plant Plant Ammonium Ammonium Plant Plant Addition Addition uptake uptake Addition Addition uptake uptake Net Net denitrification denitrification nitrification nitrification mineralisation mineralisation NO NO NH NH Organic N Organic N 3 3 4 4 Reactive Soil Zone Reactive Soil Zone Leaching Leaching Leaching Leaching to river to river to river to river NO NO NH NH 3 3 4 4 Groundwater Zone Groundwater Zone
Land Uses and Fertiliser Inputs Each land use parameterised separately for all the above N Fertiliser in kg N ha-1yr-1
Annual Hydrology Low summer rainfall protects the river from extra evaporation – to some extent
Period of River Recharge Shortens Consecutive months without hydrologically-effective rainfall
What Happens to Nitrate? EU Drinking water standard: 11.3 mg/L 60-year realisation of nitrate in the R. Kennet: baseline climate
Mean Nitrate Concentrations Crop changes due to socio-economic & climate change Crop changes due to socio-economic factors only Crops in reference state (1990)
Variation in Nitrate: 2050 A2 Socio-economic change makes a difference – adding climate change has no effect
Variation in Nitrate: 2050 B2 Socio-economic change makes small difference – adding climate change increases it
Other Modelling Work Same river, same climate scenario Different downscaling method, INCA parameterisation Nitrate increases in response to climate change!
Conclusions • It is possible to predict the effects of climate change on river flows and • water quality, but a long chain of models and assumptions is required; • Different assumptions can lead to radically different outcomes; • These start at the top of the model chain – some GCMs give a substantial • increase in rainfall by 2050 when downscaled to this catchment; • The SRES Scenarios are looking a bit dated – need an “Energy Security” • scenario? • Better confidence on the hydrological predictions than the water quality – • need to understand the effects of temperature and hydrological change • on nitrogen cycle processes much better than we do; • The work shows that potentially, changes in the world agricultural system • can affect water quality at the catchment scale, but it is hard to predict • what that influence might be in individual cases; • Might have more predictive power at a more aggregated scale
Implications for China The methodology would be transferable, but the results of course are not; Technological and economic change is likely to be greater in China than the UK (?) and thus even more important as a driver of change; With current understanding, only worth doing at a highly aggregated scale May be more valuable in generating a set of plausible scenarios than in making predictions. THANK YOU