Download
1 / 56
560 likes | 657 Views
Detection and analysis of transcriptional control sequences. Wyeth Wasserman October VanBUG Seminar. Centre for Molecular Medicine and Therapeutics Children’s and Women’s Hospital University of British Columbia. Transcription Simplified. URF. Pol-II. URE. TATA.

E N D
Detection and analysis of transcriptional control sequences Wyeth Wasserman October VanBUG Seminar Centre for Molecular Medicine and Therapeutics Children’s and Women’s Hospital University of British Columbia
Transcription Simplified URF Pol-II URE TATA
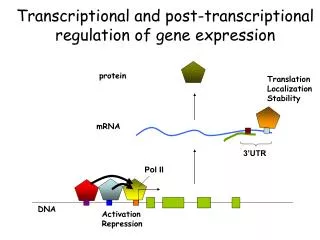
Overview of Transcription in Gene Regulation • At the most basic level, transcriptional regulation is defined by binding of TFs to DNA • Complexity is increased by TF interactions, chromatin structure and protein modifications • How can we advance our understanding of regulation by computational analysis?
A matrix describing a a set of sites A 14 16 4 0 1 19 20 1 4 13 4 4 13 12 3 C 3 0 0 0 0 0 0 0 7 3 1 0 3 1 12 G 4 3 17 0 0 2 0 0 9 1 3 0 5 2 2 T 0 2 0 21 20 0 1 20 1 4 13 17 0 6 4 Representing Binding Sites for a TF (HNF1) • A single HNF1 site • AAGTTAATGATTAAC • A set of sites represented as a consensus • VDRTWRWWSHDWVWH
TGCTG = 0.9 PFMs to PWMs One would like to add the following features to the model: 1. Correcting for the base frequencies in DNA 2. Weighting for the confidence (depth) in the pattern 3. Convert to log-scale probability for easy arithmetic w matrix f matrix A 5 0 1 0 0 C 0 2 2 4 0 G 0 3 1 0 4 T 0 0 1 1 1 f(b,i)+ A 1.6 -1.7 -0.2 -1.7 -1.7 C -1.7 0.5 0.5 1.3 -1.7 G -1.7 1.0 -0.2 -1.7 1.3 T -1.7 -1.7 -0.2 -0.2 -0.2 Log() p(b)
Performance of Profiles • 95% of predicted sites bound in vitro (Tronche 1997) • MyoD binding sites predicted about once every 600 bp (Fickett 1995) • The Futility Theorem • Nearly 100% of predicted transcription factor binding sites have no function in vivo
Phylogenetic Footprinting 70,000,000 years of evolution reveals most regulatory regions.
Phylogenetic Footprinting to Identify Functional Segments % Identity 200 bp Window Start Position (human sequence) Actin gene compared between human and mouse with DPB.
Regulatory sites are usually conserved between orthologous genes HUMAN ACGATACGCATCACAGACT.ACAGACTACGGCTAGCA -|-|||||||||-|---|--|||-------|-|---| MOUSE GCAATACGCATCGCGATCAGACATCAGCACG.TGTGA HUMAN ACATCAGCATACACGCAACTACACAGACTACGACTA ---|||||-||||---|-|----||-||-||||--- MOUSE CGTTCAGCTTACAGCTAGCATAGCATACGACGATAC
Choosing the ”right” species...(BONUS: What’s the ultimate sin in bioinformatics?) CHICKEN HUMAN MOUSE HUMAN COW HUMAN
Performance: Human vs. Mouse • Testing set: 40 experimentally defined sites in 15 well studied genes • 85-95% of defined sites detected with conservation filter, while only 11-16%of total predictions retained
Unraveling Transcriptional Control Mechanisms Given a set of ”co-regulated” genes, define motifs over-represented in the regulatory regions
Pattern Detection Methods • Exhaustive • e.g. “Moby Dick” (Bussemaker, Li & Siggia) • Identify over-represented oligomers in comparison of “+” and “-” (or complete) promoter collections • Monte Carlo/Gibbs Sampling • e.g. AnnSpec (Workman & Stormo) • Identify strong patterns in “+” promoter collection vs. background model of expected sequence characteristics
DNA-damage response partially mediating by MCB Classic cell-cycle array data re-clustered by Getz et al PDR3-regulated genes from array study Yeast tests of YRSA System
THE PROBLEM:Pattern Detection in Long Sequences MEF2 SIMILARITY SCORE MEF2 SET RANDOM SET SEQUENCE LENGTH
Four Approaches to Extend Sensitivity • Phylogenetic Footprinting • Human-Mouse eliminates ~75% of sequence • Better background models • e.g. AnnSpec • Better definition of co-regulation • Microarrays occasionally produce noise • Use biochemical knowledge about TFs • TFBS patterns are NOT random
Some characteristics have been explored… • Segmentation: informative positions separated by variable positions (proteins bind as dimers) • Positional Variance: subset of positions contain most of the info • Palindromes are common in the patterns
Our Hypothesis • Point 1: Structurally-related DNA binding domains interact with similar target sequences • Exceptions exist (e.g. Zn-fingers) • Point 2: There are a finite number of binding domains used in human TFs • Approximately 20-25 • Idea: We could use the shared binding properties for each family to focus pattern detection methods • Constrain the range of patterns sought
Frequency Score Comparison of profiles requires alignment and a scoring function • Scoring function based on sum of squared differences • Align frequency matrices with modified Needleman-Wunsch algorithm • Calculate empirical p-values based on simulated set of matrices
Match to bHLH Prediction of TF Class TF Database (JASPAR) COMPARE Jackknife Test 87% correct Independent Test Set 93% correct
APPLICATION:Cancer Protection Response • Detoxification-related enzymes are induced by compounds present in Broccoli • Arrays, SSH and hard work have defined a set of responsive genes • A known element mediates the response (Antioxidant Responsive Element) • Controversy over the type of mediating leucine zipper TF • NF-E2/Maf or Jun/Fos
Classify New TF Motif Gibbs Sampling Gibbs with FBP Prior Maf (p<0.02) Jun (p<0.98) Application (2) Problem: Given a set of co-regulated genes, determine the common TFBS. Classify the mediating TF. We expect a leucine zipper-type TF.
Regulatory Modules TFs do NOT act in isolation
Layers of Complexity in Metazoan Transcription Chromatin picture used with permission of Zymogenetics.
Liver Differentiation (data mostly from studies of hepatocytes) Early Fetal Mature Stem CEBPa HNF3 HNF1 HNF4
Models for Liver TFs…(Data that takes 2 months to produce and 10 seconds to present) (Or, what to do with an astrophysicist new to bioinformatics) HNF3 HNF1 HNF4 C/EBP
Training predictive models for modules • Limited by small size of positive training set • We elected to use logistic regression analysis for the first models • Your favorite statistical approach would probably do equally well • data limited
Logistic Regression Analysis * a1 * a2 * a3 * a4 Optimize a vector to maximize the distance between output values for positive and negative training data. Output value is: elogit p(x)= 1 + elogit S “logit”
UDPGT1 (Gilbert’s Syndrome) Wildtype Mutant Liver Module Model Score “Window” Position in Sequence
LRA Models do not account for multiple sites for the same TF* PERFORMANCE • Liver (Genome Research, 2001) • At 1 hit per 35 kbp, identifies 60% of modules • Limited to genes expressed late in liver development • Skeletal Muscle (JMB, 1998) • Set to 1 prediction per 35 000 bp • Identifies 66% of test set correctly * Side-track: Newer Methods
Genome Scan • Screened the available mouse genomic sequences (~300 MB) for modules and discarded hits for which sequence was not conserved with human (BLAST) • Removed regions for which corresponding human sequence did not score as module • Of ~100 predicted modules • 20 annotated genes: 5 from training, 3 additional modules, 5 liver specific, 3 unknown and 4 not liver
Predictive Models 6 0 0 0 7 0 0 2 8 4 7 1 0 2 0 0 4 0 0 8 0 0 0 0 1 0 0 6 Identify and Model Contributing TFs Focus on regulatory modules for pattern detection Cluster Genes by Expression
Finding binding sites in sets of co-regulated human genes • Sequence “space” is too large • Narrow with Phylogenetic Footprinting • Identify patterns in conserved blocks via Gibbs sampling • Assess quality of patterns based on biological knowledge
Skeletal Muscle Genes • One of the most extensively studied tissues for transcriptional regulation • 45 genes partially analyzed • 26 genes with orthologous genomic sequence from human and rodent • Five primary classes of transcription factors • Principal: Myf (myoD), Mef2, SRF • Secondary: Sp1 (G/C rich patches), Tef (subset of skeletal muscle types)
Regulatory regions directing muscle-specific transcription MyoD/Myf SRF Mef2 Tef
de novo Discovery of Skeletal Muscle Transcription Factor Binding Sites Mef2-Like SRF-Like Myf-Like


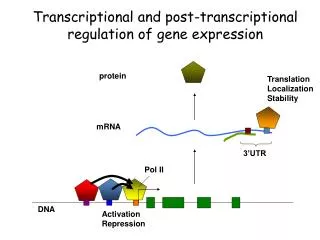
![[VI]. Post-Transcriptional Processing and Post-Transcriptional Control of Gene Expression](https://cdn1.slideserve.com/3214110/vi-post-transcriptional-processing-and-post-transcriptional-control-of-gene-expression-dt.jpg)
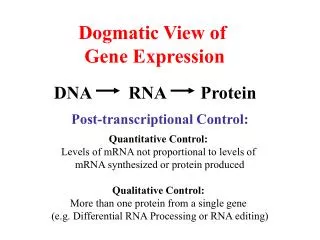
![[V]. Process of Transcription and Transcriptional Control of Gene Expression](https://cdn2.slideserve.com/5058527/v-process-of-transcription-and-transcriptional-control-of-gene-expression-dt.jpg)