Download
1 / 11
110 likes | 151 Views
Explore the effects of population structure on dynamics, including survivorship patterns, age-specific birth rates, and life history diversity. Study the exponential and logistic models of population growth and understand the patterns they present. Discover the implications of life tables and age-structured population growth models on different organisms. Gain insights into the variation in life history strategies among plants.

E N D
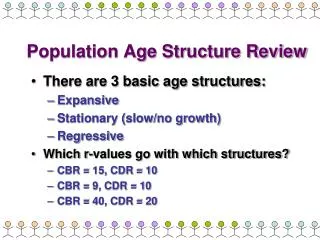
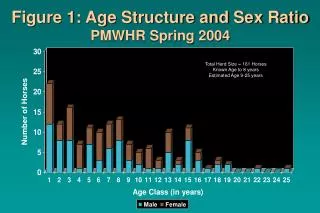
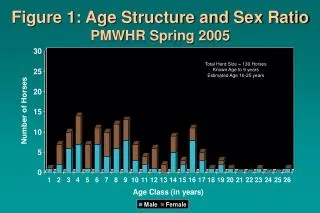
4. Effects of population structure on dynamics a. Sex ratio b. Age structure c. Life tables d. Life history 1) Survivorship patterns 2) Age-specific birth rates 3) Life history diversity
Ecology the study of the distribution and abundance of organisms
dN/dt = rN r > 0 population will grow r = 0 population won’t change r < 0 population will shrink
dN/dt = r N [(K - N)/K] For: r=0.1 K=100 if N = 10 dN/dt = .1 (10) [(100 - 10)/100] = .1 (10) (.9) = .9 if N = 99 dN/dt = .1 (99) [(100 - 99)/100] = .1 (99) (.01) = .099
Fig. 52.11 The patterns of exponential and logistic population growth
What do I need to know about these models? ExponentialLogistic Pattern: J-shaped S-shaped Equation*: dN/dt = rN dN/dt = rN[(K-N)/K] Assumptions: -growth rate constant growth rate decreases with pop size -unlimited env. carrying capacity * Know what each term means and how changes in the terms affect the pattern of population growth.
A Life Table Number Probability of #Offspring born Age aged x survival to x to females aged x 0 600 1.0 0 1 300 0.5 0 2 240 0.4 2 3 60 0.1 3 4 30 0.05 5 A model for growth of an age-structured population: Nt+1/ Nt = S (probability of survival to x)(#offspring at x)
Variation in life history among plants Live long, reproduce once and die Live not so long, reproduce early Live long, begin reproduction late