Download
1 / 23
230 likes | 244 Views
This ANOVA test assesses the impact of fertilisation on the height growth of seedlings. The study aims to determine if there is a significant difference in growth between different fertilisation levels.

E N D
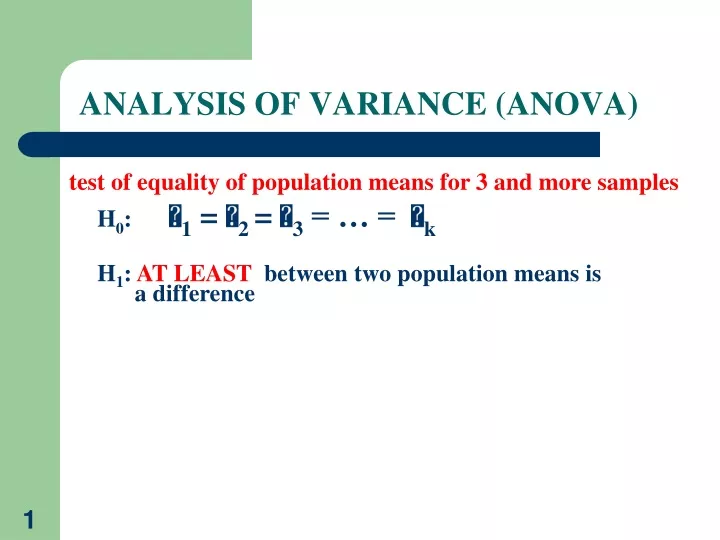
ANALYSIS OF VARIANCE (ANOVA) test of equality of population means for 3 and more samples H0: 1 = 2 = 3 = … = k H1: AT LEAST between two population means is a difference
ANOVA We want to evaluate the infuence of fertilisation on height growth of seedlings H0: fertilisation has no influence strong fertilisation without fertilisation middle fertilisation H1: fertilisation has significant influence
ANOVA 1 none 2 FERTILISATION middle 3 strong
H0: 1 = 2 = 3 are random and in population statistically insignificant ANOVA middle fertilisation strong fertilisation without fertilisation
H1: 12 3 are significant and in population statistically significant ANOVA strong fertilisation without fertilisation middle fertilisation
1 2 3 1 2 3 ANALÝZA ROZPTYLU (ANOVA) Variability withinsamplesisSMALL in comparisonwithvariability betweensamples GOOD DIFFERENTIATION OF MEANS Variability withinsamplesisLARGE in comparisonwithvariability betweensamples BAD DIFFERENTIATION OF MEANS
ANOVA 2 SAMPLES 3 AND MORE SAMPLES t – test ANOVA paired t – test ANOVA with repeteated measurements Mann-Whitney Kruskal-Wallis test
ANOVA - conditions • all samples are independent • all samples come from populations with normal distributions • all samples come from populations with equal variances
sample B sample B sample A sample A samples A and B are dependent samples A and B are independent ANOVA – checking of conditions • independence • normality – test of normality • equalityofvariances – • Cochran test – forequal sample size, • Barttlet test – forunequal sample size
EFFECT changeof sample meancaused by factor ERROR MEASURED MEAN VALUE ANOVA –model Model of 1-F ANOVA: yij = + i + ij
1-F ANOVA - result table Mean square (variance) Degrees of freedom Test criterion Source of variability Sum of squares between samples within samples (residual) Total F > F,k-1,N-k H1
STOP H accepted 0 DATA AN O VA multiply comparison tests H rejected 0 1-F ANOVA – next step?
ANOVA – multiply comparisons H0: A = B , (A B) H1:AB Comparisons are made for possible combinations of samples.
Fisher • Tuckey • Scheffe and many others … ANOVA – multiply comparisons
TuckeyHSD test H0: A = B , (A B) H1:AB, For q >q; N-k; k; (quantil of studentized range) we reject H0 and difference of means of samples A and B is significant
If S> then there is significant difference between population means A and B. Scheffe test H0: A = B , (A B) H1:AB,
2-F ANOVA - model yij measured value influenced by i-th level of factor A a j-th level of factor B average common value of yij (common for all samples) i effect of level Ai j effect of level Bi interaction between factors (optional , there are models with interaction or without interaction) ij random error N(0,2)
2-F ANOVA - interaction Study is dealing with the impact of various doses of nitrogen (N) and phospforus (P) on yield of crop. Both elements have two levels – N (40, 60), P(10,20). Results of first three experiments:
expectation N=60 measured 2-F ANOVA - interaction What yield we obtain when for N = 60 we increase dose of P to 20? we expect 180
expected measured 2-F ANOVA - interaction Result of 4th experiment: skutečnost
2-F ANOVA - interaction Paralel lines – effects of factors are additive (factors are independent) Crossed lines– – effects of factors are not additive - there is interaction between factors Interaction is present if effect of one factor is not the same when levels of the other factors are changed. So factors are not independent but response on one factor depends on levels of other factors.