Download
1 / 6
60 likes | 77 Views
This paper discusses the communication scheduling in time-triggered systems, focusing on safety-critical distributed embedded systems. It presents a hardware architecture and a scheduling example, along with experimental results.

E N D
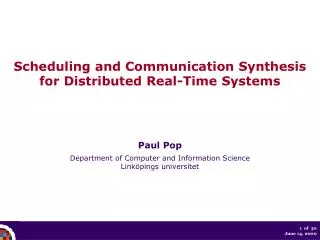
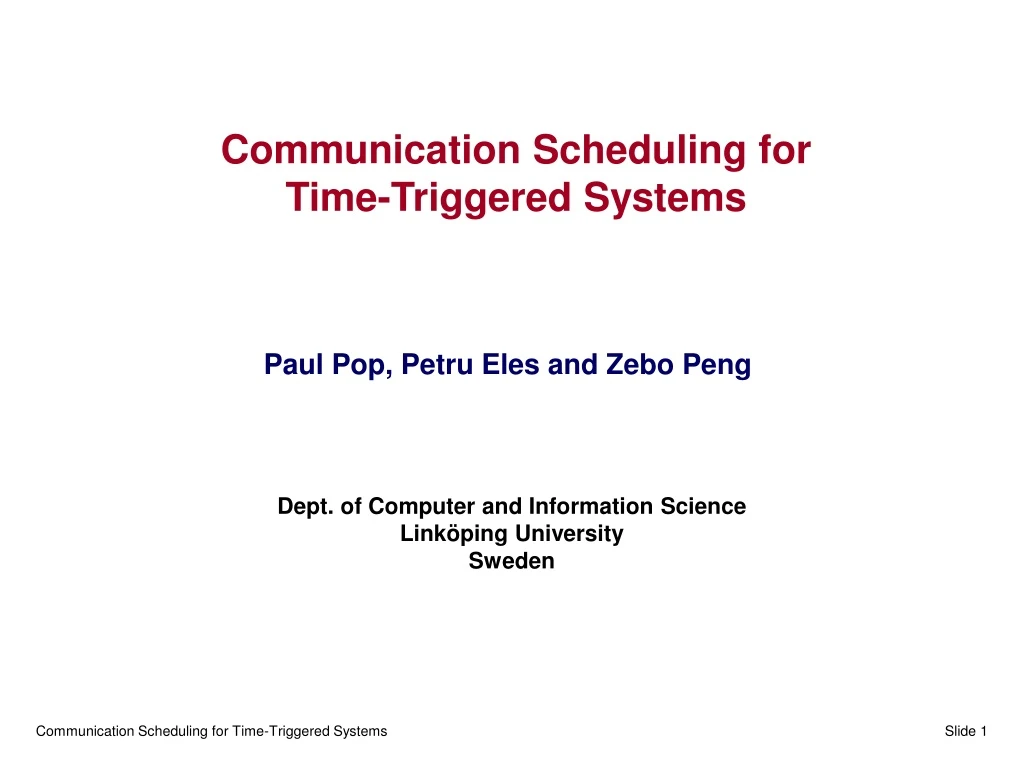
Communication Scheduling for Time-Triggered Systems Paul Pop, Petru Eles and Zebo Peng Dept. of Computer and Information ScienceLinköping UniversitySweden
Subgraph corresponding to DCK P0 P1 P11 P2 P3 K C D C P12 P6 P14 P16 P8 P9 P17 P10 P18 Conditional Process Graph P0 P1 P11 D P2 P3 C P12 P13 P6 K P4 P5 P14 P16 P8 P9 P15 P7 P17 P10 First processorSecond processorASIC P18
I/O Interface RAM ROM CPU ASIC TTP Controller Hardware Architecture • Safety-critical distributed embedded systems. • Nodes connected by a broadcast communication channel. • Nodes consisting of: TTP controller, CPU, RAM, ROM, I/O interface, (maybe) ASIC. • Communication between nodes is based on the time-triggered protocol. • Buss access scheme: time-division multiple- access (TDMA). • Schedule table located in each TTP controller: message descriptor list (MEDL). Node S0 S1 S2 S3 S0 S1 S2 S3 Slot TDMA Round Cycle of two rounds
Problem Formulation • Input • Safety-critical application with several operating modes. • Each operating mode is modelled by a conditional process graph. • The system architecture and mapping of processes to nodes are given. • The worst case delay of a process is known: • Output • Local schedule tables for each node and the MEDL for the TTP controllers. • Delay on the system execution time for each operating mode, so that this delay is as small as possible.
P1 P4 P3 P2 m3 m4 S1 S0 m1 m2 P1 Round 1 Round 2 Round 3 Round 4 Round 5 m1 m2 P1 P4 P3 P2 P2 P3 m3 m4 m1 S0 S1 m2 Round 1 Round 2 Round 3 Round 4 m3 m4 P4 Scheduling Example 24 ms 22 ms P4 P1 20 ms P3 P2 m3 m4 m1 m2 S0 S1 Round 1 Round 2 Round 3
Experimental Results Average percentage deviationsfrom the lengths of near-optimal schedules % • The Greedy Approach is producing accurate results in a very short time (few seconds for graphs with 400 processes). • Greedy 1 performs slightly better than Greedy 2, but it is a bit slower. • SA finds near-optimal results in a reasonable time (few minutes for graphs with 80 processes and 275 minutes for graphs with 400 processes). • A real-life example implementing a vehicle cruise controller validated our approach. Number of processes