Download
1 / 15
150 likes | 162 Views
Discover the multifaceted world of agriculture, from food production to animal health, biotechnology to forestry. See how agriculture supports our basic needs and affects various industries. Learn how technology and data play crucial roles in modern farming practices. Explore different types of graphs and charts used in agricultural data analysis.

E N D
Agriculture By Megan Rees
Food Worship How many careers are mentioned or referred to in this clip alone?
Food • Grow it • Distribute it • Eat it • Prepare it • Deliver it • Transport it • Make it • Excrete it • Throw it away • Have enough of it • Give to those who need it • Raise it • Slaughter it • Package it • Catch it • Hunt it • Gather it • Preserve it • Produce it • Conserve it • Store it • Research it • Process it
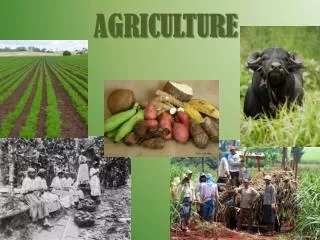
“Agriculture” also refers to: • Animal Health • Animal Diseases, well-being, research • Biotechnology • Genetic engineering, technology in farming • Conservation • Healthy soil, water air, plants, animals and ecosystems • Emergency Preparedness & Response • Tools and resources to provide food in the event of a disaster • Marketing and Trade • Trade agreements & research to expand and maintain foreign and domestic markets • Organic Agriculture • Increasing the number of organic operations which preserve the environment and avoid synthetic materials. • Plant Health • Reduce losses by plant diseases that are effective and affordable • Research & Science • Using science and research to solve problems in conservation, climate change, food security, etc. • Energy • Compare and analyze biofuels and bioenergy data • Food & Nutrition • Nutrition assistance to families in need • Food Safety • Managing safety in food processing and distribution • Forestry • Create diverse, integrated, productive, profitable healthy and sustainable land-use systems
Agriculture is more than food Many products we use every day are animal byproducts • Manufacturing • Construction • Healthcare • Personal Care Products • Transportation • Sports • Printing • Education • Entertainment Adhesives, lubricants, solvents, detergents, polymers Lumber, paints, brushes, tar paper, drywall, tool handles, particleboard Pharmaceuticals, surgical sutures, ointments, latex gloves, X-ray film Shampoo, soap, cosmetics, lotions, fingernail polish, toothpaste Biofuels, lubricants, antifreeze, tires, upholstery, packing materials Uniforms, baseball bats, leather equipment and balls, shoes Paper, ink Crayons, textbooks, chalk, desks, pencil, paper Strings for musical instruments
Agriculture Supports Our Basic Needs • Physiological needs are the #1 concern for every person on the planet. • You can’t focus on your need for love and acceptance, for example, if you are worried about breathing, or you are starving! • Therefore, Agriculture careers are at the heart of the basic needs for every living thing.
Change in Statistics • 1776 – 98% Farmers • 1950 – 12% Farmers • 2010 – 2% Farmers • 1776 Population – 76 Million • 2013 Population – 316 million Less people growing food, more people needing food And yet—we feed more people both domestically and foreign than ever before. HOW? Technology Growing food with less land and fewer producers.
Data Collection - USDA • The USDA (founded by Abraham Lincoln) gathers massive amounts of data. • This data is about consumer information, producer data, production data, and economic data, and data about America’s workforce. • They measure labor market activity, working conditions, and price changes in the economy.
Line Chart • Compare improvement and decline • Change over time
Column and Bar Charts • Column Charts and Bar Charts are interchangeable, but sometimes one is better than the other depending on the information you are graphing • Compare multiple sets of data
Pictographs • Using pictures or small symbols to compare information. • Generally used in column and bar charts.
Pie Charts • Parts of the whole • Uses percentages • Can only graph ONE set of data
Area Charts • An area chart or area graph displays graphically quantitive data. It is based on the line chart. The area between axis and line are commonly emphasized with colors, textures and hatchings. Commonly one compares with an area chart two or more quantities.
Organizational Charts • Diagrams that represent relationships between the different positions and ranks of a company through a series of boxes