Download
1 / 27
270 likes | 449 Views
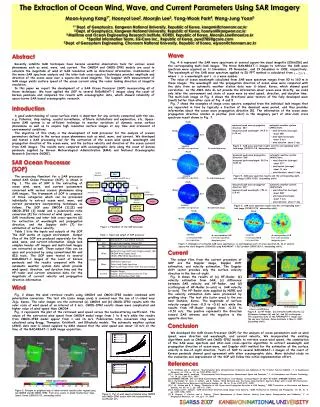
The Observation of SAR, Optical and Altimeter Data to Study the Generation of Internal Wave in Tsushima Strait. Yessy Arvelyna, Masaki Oshima Dept. of Marine Information System Engineering Tokyo University of Marine Science and Technology yessy_a@e.kaiyodai.ac.jp. Internal Waves.

E N D
The Observation of SAR, Optical and Altimeter Data to Study the Generation of Internal Wave in Tsushima Strait Yessy Arvelyna, Masaki Oshima Dept. of Marine Information System Engineering Tokyo University of Marine Science and Technology yessy_a@e.kaiyodai.ac.jp
Internal Waves • a) Can be formed at the interface between fluids of different density • b) May generated at shallow seas by tidal currents that encounter seafloor irregularities, such as submarine canyons, continental shelf edges, or other major variations in underwater topography break in slope (Apel, 2003, Lamb, 1994; Beer, 1997). • A packet of IW consists a series of gradual wave cycles and wavelength is a length of a cycle of wave consists one crest and trough (Apel & Gonzalez, 1984). • When the dispersive effect becomes significant, the shape of wave turns into curvature (Zabusky and Kruskal, 1965). The generation of internal wave by tidal flow across a banks edge (after K.G. Lamb, 1994).
Characteristics Symbol Scale Packet length L (km) 1-10 Amplitude Factor 2o(m) -15 Upper Layer Depth H1(m) 20-35 Apel, 2003 Lower Layer Depth H2(m) 30-200 Long Wave Speed Co(ms-1) 1.5-1.0 Maximum wavelength max(m) 100-1000 Crest Length Cr(km) 0-30 Internal Tidal Wavelength D=VT(km) 15-40 Soliton Width l1(m) 100 Internal Wave Characteristics
Internal Waves Effect (After K.G. Lamb, 1994) • IW carries enourmous energy, which are presumed to be the cause of unusually strong underwater currents experienced by deep-sea drilling rigs • IW can perturbs current and density field, mix nutrients to photic zone, affects to fishing ground (Colossi et al, 2001) • The propagation of internal wave into shallow-water depth forms a wave with a trapped core which can transport a parcel of fluid at great distances (K.G. Lamb, 1994). • IW generates cross-shelf transport of planktonic organism and nutrients. Even weakly swimming planktonic organism may experiences internal wave induced change in concentration. Validate by insitu data and simulation at Mission beach, California (Cody et al., 2002).
Japan Study Area : the Tsushima Strait
Facts of the Tsushima Strait • The study area around Tsushima Srait is a part of East Asian Sea, well known as a region where energy for exciting internal tides should be large (Baines, 1982; Niwa et.al, 2001). • Tsushima Strait has strong tidal variability, maximum in summer 50 cm/s, and shallow water around 200 meter (Jacobs et.al, 2001). • The regional heat flux generates a strong summer thermocline near 40 m [Hu, 1994]. • During winter, the heat flux and stronger wind stress combine to generate a uniformly mixed water column (100m). • Contrary of Tsushima water (low salinity, warm water) vs Japan Sea (high salinity, cold water) forms cyclonic circulation and subpolar front (Miyazaki, 1953; Sugimoto et al., 1992) .
left right Insitu Data at the Tsushima Strait (Kim et.al, 2001)
Internal Waves Detection in SAR and Optical Image • Data: ERS1/2 SAR & ASTER images data during 1993-2004 period. • In shallow water, internal wave modulates sea surface. Leading edge increases roughness & trailing edges decreases roughness affect (>>/<<) Bragg scattering process/sea surface reflectance bright & dark signature in SAR and optical image (Sabin, 1996). • The occurrence of crest wave enhances the reflectance • Length of crest to trough can be used to calculate the internal wave-induced current using Korteweg de Vries Algorithm, etc. • Internal wave observation is necessary for mapping, database and marine disaster contingency plan.
Internal Wave in ERS SAR Image Image over south west coast of Japan. Path/Row/I: 81/242/1 Date:Aug 1993 (c) ESA 13298, processed by CRISP, Singapore
Error: 26% or >> Internal Wave Signature Detection Probability Data: 7/4/2000 & 7/20/2000 RGB:321, VNIR Channel
Internal Wave Detection in SAR/Optical Image • Feature detection by texture and shape • In image with internal wave signature consists: texture or inflection points can be detected with edge detector for feature segmentation • Multi-resolution edge detection with wavelet transform is proposed since image contain speckle noise can resulted small strikes in image segmentation • Wavelet speckle filter based on thresholding procedure performed equally as standard speckle filter for low-level noise (Gagnon, 1997), preserved edges and thin structure better (Hervert, 1998). • Feature detection by wavelet transform coefficient and spectral reflectance characteristic.
Wavelet Transform for Internal Wave Detection in SAR/Optical Image Perform wavelet Meyer wavelet transform in image using: Step 1. Apply scaling equation to define the multi resolution approximation of image by taking account the low intensities of image, and Step 2. Apply wavelet function to define the details of image corresponds to the high intensities of image. * Wavelet coefficient is analyzed on every level of transformation.
Meyer Wavelet Transform Wavelet & scaling function: • Why Meyer wavelet is chosen: • Symmetry, which is useful in avoiding dephasing, • Orthonormal bases, for smoothness of image reconstruction • The existence of scaling func • Orthogonality, which allow fast algorithm, space-saving code and prevents discontinuities by a periodic wrapping of data (Daubechies, 1992).
Decomposition of Image using Wavelet Transform (After Mathworks, 1999) Downsample columns: keep the even indexed columns. Downsample rows: keep the even indexed rows. Convolve with filter X the rows of the entry. Convolve with filter X the columns of the entry.
Internal Wave Segmentation in SAR/Optical Image • Step edges can be localized by as positive maxima or negative minima of first order derivative of image, such as Canny detector or • as zero-crossing of the second order derivative of image, such as Marr-Hildrett edge detector (Prasad, 1997) . • The selection of inflection point through modulus of first derivative of image is more easily than from zero-crossing of the second order derivative of image. • The zero crossing of second derivative indicates only the position of the intensity changes and not their magnitude. Step 3. Applied Canny Edge detector on the transform result on approximation of image by using the first derivative of Gaussian and 2nd derivative edge operator to smooth out image and delineate crests in image.
Internal Wave Detection Results Data: 7/4/2000 & 7/20/2000 RGB:321, VNIR Channel
The Internal Wave Detection Results Original Data Processed image using Discrete Haar wavelet Processed image using Discrete Meyer wavelet at level 5
Detection Probability of observed data: 81% (if island is exist), 95% (no island) Error: > 26% • Sea and internal wave crest can be classified well • Classification rate 100%
IW Segmentation Results Segmentation of original image w/o Gaussian Filter resulted small strikes from noise and crest lines cannot be detected clearly in image Proposed method with Meyer transform at level-4 and 5, maintain the continuity of crest line while reduced small strikes better
Spectral Reflectance Analysis • Results: • IW: >> VNIR: 520-660nm, • << SWIR 760-2430nm, due to the absorption and scattering.
Combined KdV Equation: V=velocity of the internal wave induced current, A=interface depth modulation by an internal wave, A0=amplitude, t=time, x=distance along the x-axis, 1&2 =density of top andbottom water layer, c0=linear internal wave propagation speed, h1 andh2 =thickness of the top and bottom water layer, and g= gravitational acceleration. The Internal Wave Induced Current • Strong currents occur when internal waves impinge of a submarine canyon. This current is known as internal wave induced current/IW-IC (T. Beer, 1997). • IW-IC is calculated using the Combined KdV (combKdV) since the IW condition over the assumption that the total water depth is significantly larger than two times the crest-to-trough distance of the internal wave (for KdV) (Apel et al., 1995 and Korteweg et al.,1995, Ostrovsky and Stepanyants, 1989). • Internal wave packet in the Tsushima Strait is modeled using the parameters as follows, density of top and bottom layer is 1024 kg/m3 and 1025.5 kg/m3 respectively, the depth of mixed layer is 40 m and the depth is 200 m, taken from measurement data using ADCP within Tsushima Strait (Jacobs et al., 2001 and Isobe, 1994). • IW induced current 0.85 m/s (twice faster!).
Observation of T/P Images • Sea level anomaly data and absolute dynamic topography data derived from T/P data are used to analysis the oceanic condition where internal wave occurs. • The ocean dynamic topography data is determined by using the difference between the height of sea surface measured by altimetry and the height of geoid. Sea surface height anomalies is calculated with the seasonal cycle removed. • Considering to the availability of T/P data, Jason-1 data were also observed. Jason-1 is the follow-on to T/P from December 7, 2001, which has the same payload and flies in the same orbit of T/P.
Map of Sea Level Anomaly • Monitoring result in SW of Japan : Internal waves were mostly occurred at north coast of Kitakyushu and NW/W/SW/E coast of Tsushima Island on June to September period, during summer when the layers are strongly stratified. • The directions of propagation were varies to NW-SW at eastern channel and N-SW at western channel of Tsushima Strait. • The length of the internal waves : 6-28 km and wavelength between 120m-1.28km. • IW occurred at the location where the sea level anomaly steeply arises with difference 2-5 cm
Map of Geostrophic Current • In the Tsushima Strait, the geostrophic current generally flows from SW direction yearly around. • During summer, the small-scale eddies appear at NE and SE coast off Tsushima Island, due the effect of current flows at south of the Japan Sea. • The directions of internal waves were varied between NW-SW at eastern channel and N-SW at western channel of Tsushima Strait, parallel to the direction of the geostrophic currents. • Meanwhile at NE coast off Tsushima Island, the internal wave packet propagates to S/SE direction.
Conclusions • The proposed method using wavelet transform has succeeded in internal wave detection in image while maintains the wave shape, creates more continuous shape and reduces streak lines occurs from noise, retained higher coef. 2.5-4 times than sea, provide the accuracy in classification over than 80%. • Though the application of wavelet transform can amplified the internal wave feature in image, the height of leading wave may be reduced due to shape of wavelet and equation function • It is suggested that the internal waves were sourced from south coast off Tsushima Island and south coast off the Japan Sea. They were tidally generated and formed due to bathymetric change. • Further study is being investigated to couple the oceanographic data around this area.