Download
1 / 37
420 likes | 1.23k Views
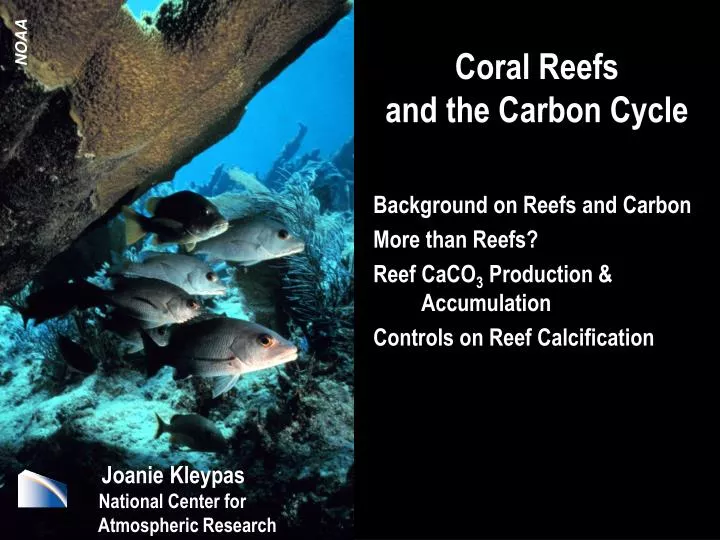
NOAA. Coral Reefs and the Carbon Cycle. Background on Reefs and Carbon More than Reefs? Reef CaCO 3 Production & Accumulation Controls on Reef Calcification. Joanie Kleypas National Center for Atmospheric Research.

E N D
NOAA Coral Reefsand the Carbon Cycle Background on Reefs and Carbon More than Reefs? Reef CaCO3 Production & Accumulation Controls on Reef Calcification Joanie Kleypas National Center for Atmospheric Research
Coral reef systems are not big players in the organic component of the C-cycle, but ARE in terms of CaCO3 • Other shelf ecosystems may be important in accumulation of CaCO3 but their budgets are poorly constrained • Coral reef CaCO3 production appears to have declined after sea level stabilized This may be a natural process related to reef succession change in morphology or community structure Conclusions
NOAA Coral Reefsand the Carbon Cycle Background on Reefs and Carbon More than Reefs? Reef CaCO3 Production & Accumulation Controls on Reef Calcification
Coral Reefs- Organic Carbon Production - • Organic Carbon Production in Low Nutrient Waters • High organic production (79–584 g C m–2 y–1) • Topographically induced upwelling, internal tidal bores; ‘endo-upwelling’ • Efficient production of organic carbon (Nitrogen fixation) C : N : P Coral reefs: 550:30:1 Open ocean: 106:16:1 Smith, 1988
Coral Reefs- Organic Carbon Production -(Gattuso, Frankignoulle, Wollast 1998) Pg/R Reef Flats: 1.07 ± 0.1 (n=43) Reef System: 1.28 ± 0.2 (n=9) Respiration Gross Production Organic C metabolism of coral reefs is balanced or slightly autotrophic
Coastal Ecosystems- Organic Carbon Production -(Gattuso, Frankignoulle, Wollast 1998)
Coastal Ecosystems - Organic Carbon Production -(Gattuso, Frankignoulle, Wollast 1998)
Coral Reefs - Inorganic Carbon Production -(Milliman 1993; Milliman & Droxler 1996) Habitat Area CaCO3 CaCO3 CaCO3 flux glob. prod. accum. x106 km2 g/m2/y 1012 mol/y 1012 mol/y reefs 0.6 1500 9 7 banks 0.8 500 4 2 carbonate 10.0 20-100 6 3 shelves open ocean 290.0 20 60 11
Coral ReefHypothesis Changes in basin-shelf partitioning of CaCO3 production caused glacial-interglacial fluctuations in atmospheric CO2 Berger 1982; Opdyke & Walker 1992; Walker & Opdyke 1995 Kleypas 1997 → shelf flooding initiated pulse in CaCO3 but not until 8000 yBP Archer et al. 2000 → can explain portion – but not all – of post-glacial CO2 rise Ridgwell & Kennedy 2004 → 20 ppm CO2 increase in late Holocene Ridgwell and Kennedy 2004
Estimates of Shelf CaCO3 Flux *Reef environments only Modified from Opdyke & Schimel 2000
600,000 km2 Smith’s (1978) reef area estimate • Smith & Kinsey’s (1976) avg calc’n rate: • 20% reefs @ 4000 g m-2 y-1 • 80% lagoons @ 800 g m-2 y-1 1500 g m-2 y-1 0.9 x 10⁹ tons CaCO3 y-1 Net CaCO3production 10% dissolved/exported 10% biological erosion/“corrosion” 20% 0.7 x 10⁹ tons CaCO3 y-1 Net CaCO3 accumulation
NOAA Coral Reefsand the Carbon Cycle Background on Reefs and Carbon More than Reefs? CaCO3 Production & Accumulation Controls on Reef Calcification
How Good are Estimates of Shelf Accumulation? • Coral reefs are the “gold standard” of high carbonate production • Almost all estimates of shelf carbonate production have concentrated on coral reefs “… cold water corals may cover as large an area as … warm-water corals that form shallow reefs” (Williams et al., Eos 21 Nov 2006) “The mean annual calcification of L. corallioides populations … are similar to those reported for tropical coralline algae …” (Martin et al. 2006) “These production and accumulation rates are similar to the lower end of such rates from tropical coral reef environments” (Bosence and Wilson 2003)
How Good are Estimates of Shelf Accumulation? • What about non-tropical carbonates? • Milliman & Droxler 1996 estimated that for non-tropical shelves: • calcification rates < 20% of tropical carbonates • net accumulation ~ 30% of tropical carbonates These data are even less constrained than for reefs
Types of Shallow Water Carbonates Organism: Corals Calcareous algae Coralline red algae Green algae Halimeda/Penicillus Forams Sponges Bryozoans Brachiopods Molluscs Annelids Echinoderms Arthropods • System: • Coral Reefs • Halimeda banks • Coralline algae & rhodolith beds • Cold-water reefs • Cool-water carbonates • Ooid shoals • Oyster banks • …. etc
Calcification Rates of Benthic Calcifiers PHOTOTROPHIC
Recent ‘discoveries’: Rhodoliths / Maerl Beds In high latitudes, usually clear water In tropics/ subtropics, where coral reefs are unsuccessful Foster 2001 McCalester
Bosence & Wilson 2003 (NE Atlantic Maerl Beds) • These production and accumulation rates are similar to the lower end of such rates from tropical coral reef environments. This is achieved by high standing crops that compensate for the lower growth rates of the temperate algae.
Recent ‘discoveries’: Cold-water corals(not quite “shelf” deposition) Challenger Mound: Eos, 21 Nov 2006 Trevor Williams and 29 others Mounds: 600-900 m depths Up to 155 m accumulation over 2 MY (10 m per glacial cycle) Roberts et al. Science 2006
AIMS Coral Reefsand the Carbon Cycle Background on Reefs and Carbon More than Reefs? Reef CaCO3 Production & Accumulation Controls on Reef Calcification
Budget for Reef:Greef+ Dreef+Tr (net Gshelf > Greef) Budget for C-Cycle: Gshelf+ Dshelf G = Community calcification + inorganic cementation (+) D = Dissolution (–) Tr = Transport on/off reef (+ or –; usually –) Rates vary with T, Ω, light, … Rates vary with T, Ω, bioerosion … Rates vary with framework versus sediments, hydrodynamic regime, shelf morphology, … Export limits reef development without necessarily affecting carbon cycle.
Calcification Measurements(not always the same thing) Organisms & Communities Systems
Alkalinity Anomaly Net organism calcification Net organism calcification Photo/Resp. Calcification Exchange with the ocean Inputs from land Inorganic Cementation Dissolution Sediment Volume Net reef accumulation Organic Matter Resp. Inorganic Cementation Dissolution Bioerosion Dissolution export
Photo/Resp. Net organism calcification 0.8-1.5 g cm2 y-1 Calcification Inorganic Cementation Dissolution Net community calcification 0.1-1.3 g cm2 y-1 Net reef accumulation 0.75-0.90 g cm2 y-1 Bioerosion 0.1-0.5 g cm2 y-1 0.004-0.07 g cm2 y-1 Dissolution export
A High Preservation Rate? • Reef accumulation rates indicate • very little carbonate loss • ... OR … • today’s calcification rates are lower than in the past • Coral reefs have declined from anthropogenic stress in the last century, but coral reef calcification has probably been declining for thousands of years.
Changes in Reef CaCO3 Accumulation Over Time(Wistari Reef, Australia) Average Holocene Accumulation 2 4 6 8 10 Accum. Rate g cm-2 y-1 Accumulation History 10 9 8 7 6 5 4 3 2 1 0 103 Years Before Present Ryan et al. 2001
Post-glacial Reef Deposition 5000 ybp 5000 ybp 3000 ybp TR↑ 7000 ybp 8000 ybp 9000 ybp Reef growth progressively limits hydrographic exchange and residence time increases
Saturation State Changes with Residence TimeBroecker & Takahashi 1966 Bahamas Bank
G (kg m-2 y-1) 5.5 Calcification Rates versus Residence Time Demicco & Hardie 2002 0.0 G = ƒ(z,Tr) Carbonate production is favored at edges of the platform and slows down dramatically beyond 20 m of edge. 200 Tr (days) 0 Demicco & Hardie, J. Sed Res. 2002
Growth forms can affect production and accumulation rates per m2 NOAA 7,000 g m-2 y-1 Did the emergence of Acropora accelerate carbonate production? 18,300 g m-2 y-1
Model of Reef Growth versus Sea Level Rise drowned/ sediment massive branching 1 branching 2 120 m seafloor
NOAA Coral Reefsand the Carbon Cycle Background on Reefs and Carbon More than Reefs? Reef CaCO3 Production & Accumulation Controls on Reef Calcification
Physical Variables that Affect Calcification • TemperatureLatitude • Saturation StateLatitude • Irradiance Depth, Latitude T Ω
“Darwin Point” Clue #1: reef-building at higher latitudes occurs in very clear waters Clue #2: reef depth shallows at higher latitude Between Equator and 30º is a 5x decrease in Porites calcification rate Saturation state is a factor, but SST and light probably are as well
The basic calculation: Light-based calcification calculated on an hourly basis for a full year and total calcification over the entire depth of the reef is summed.
Zmax = log(Imin/Isurf) K490 G = Gmax tanh Iz/Ik Iz typically 2000 μEins m-2 s-1 Ik 250-300 μEins m-2 s-1 … light is not limiting at surface
LightOnly clear murky