Download
1 / 21
210 likes | 344 Views
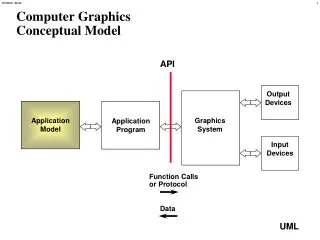
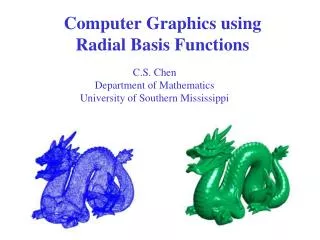
Identifying Computer Graphics Using HSV Model And Statistical Moments Of Characteristic Functions. Xiao Cai, Yuewen Wang. Definition. Computer graphics, created by a variety of rendering software (C.G.)

E N D
Identifying Computer Graphics Using HSV ModelAnd Statistical Moments Of Characteristic Functions Xiao Cai, Yuewen Wang
Definition • Computer graphics, created by a variety of rendering software (C.G.) • Photographic images, the output of imaging acquisition devices such as the digital camera. (P.I.)
Q: Can you tell me which two are the computer graphics and which two are the photographic image?
outline • Introduction • Selection of color model & Image features • Experiment • Conclusion and future works
Paper Objective and Problem Statements This paper aims at the development of a novel method to automatically separate computer graphics from photographic images based on the following problem statements: - The detection of computer graphics can be regarded as a two-class pattern recognition problem - Feature-based methods are of our interest - There should exist some appropriate features that are capable of distinguishing computer graphic images from photographic images with high accuracy
The Breakthrough of This Paper • On one hand, this technology will defeat the image forgery in the following areas: criminal investigation, journalism, etc. • On the other hand, It will improve the rendering technology to generate more photorealistic computer graphics used in movie industry.
The difference between C.G &Photographic images • Computer graphics are more color smooth than photographic images in the texture area • Fewer colors are contained in computer graphics
Comparison • [1] T. Ianeva, A. de Vries and H. Rohrig “Detecting cartoons: a case study in automatic video-genre classification,” (modeling the characteristics of cartoon, the dimensionality of features is 108) • [2] S. Lyu and H. Farid, “How realistic is photorealistic?”(the first four order statistics and 3 directions subbands, the dimensionality of features is 216) • [3] T.-T. Ng, S.-F. Chang, J. Hsu,L. Xie, and M.-P. Tsui, “physics-motivated features for distinguishing photographic images and computer graphics,”(the geometry features are characterized by differential geometry, fractal geometry and local patch statistics the dimensionality of features is 192)
The representations of color images • RGB (Red, Green, Blue) • HSV (Hue, Saturation, Value) Chromaticity Brightness In the HSV model, the luminous component (brightness) is decoupled from color-carrying information (hue & saturation) When viewing a color object, human visual system characterizes it brightness and chromaticity separately.
Moments of wavelet characteristic function Specifically, we have shown that a statistical model based on first- and higher-order wavelet statistics reveals subtle but significant differences between photographic and photorealistic images.
The construction of prediction-error image • The prediction-error image is generated by subtracting the predicted image from the corresponding original image. • The prediction algorithm utilized to create the predicted image is given in the followings
Feature extraction The first 3 levers of Haar wavelet • HSV-based features (compared to RGB-based features) • 234=78x3, 78=39x2, 39=13x3, 13=1+3x4 The first 3 moments Original image 4 direction subbands Original &prediction error H,S,V or RGB
Image database • In this experiments, the author uses 1,900 photographic images (P.I.): 800 from the Columbia Image Dataset 400 from Philip Greenspun’s personal collection 700 from Google Image Search 800 computer graphics (C.G.): All from the Columbia Image Dataset
SVM Classifier • The Support Vector Machine (SVM) classifier with RBF (Radial Basis Function) kernel is employed in the two-class classification experiment; • Use the “grid-search” method of LIBSVM to find the optimal penalty parameter C and kernel parameterγ of RBF kernel; • The number of iteration is 20; • Randomly select 5/6 of image set as the training samples(1580 P.I. and 665 C.G.), and select the other 1/6 ,which are not involved in the training stage, as the testing samples(135 P.I. and 135 C.G.)
Experimental Results • TP (true positive) represents the detection rate of computer graphics ,while TN (true negative) represents the detection rate of photographic images. • The accuracy =(135x TP+135x TN)/(135+135)=(TP+TN)/2 • The best classification result using the optimal parameters for 3 components and for 2 components are shown in the follows 156-D features [2]
Results analysis • The accuracy is 82.1% for HSV-based features, which is 5.2% higher than the accuracy of RGB-based features, which can indicate that the color model has an obvious influence on the effectiveness of image features. • The proposed HSV-based features outperform the 216 wavelet features proposed in [2], which collects features in RGB space • The 156 features from the hue and brightness components can achieve accuracy of 79.6%, which is better than the 234 RGB-based features and comparable to the 216 wavelet features[2]
Conclusion and the future work • The distinguishing features are formed by using statistical moments of characteristic function of wavelet subbands and their prediction-errors, whose effect has been investigated; • The proper selection of color image representation is important to extract effective features; • One of the works in the future is to design an optimization algorithm to search for the best color model; • Another work is to use some methods, like boosting to select a reduced features set without significant degradation in classification performance.
Consider a two-class prediction problem (binary classification), in which the outcomes are labeled either as positive (p) or negative (n) class. There are four possible outcomes from a binary classifier. If the outcome from a prediction is p and the actual value is also p, then it is called a true positive (TP); however if the actual value is n then it is said a false positive (FP). Conversely, a true negative has occurred when both the prediction outcome and the actual value are n, and false negative is when the prediction outcome is n while the actual value is p. • In signal detection theory, a receiver operating characteristic (ROC), or simply ROC curve, is a graphical plot for a binary classifier system as its discrimination threshold is varied. The ROC can also be represented equivalently by plotting the fraction of true positives (TPR = true positive rate) vs. the fraction of false positives (FPR = false positive rate).