Download
1 / 22
220 likes | 336 Views
Pulsations and magnetic activity in the IR. Rafa Garrido & Pedro J. Amado Instituto de Astrofísica de Andalucía, CSIC. Granada. Acoustic oscillations. Angular dependence (l,m). Radial dependence (n). 1996 standard solar model. inclusion of He settling

E N D
Pulsations and magnetic activity in the IR Rafa Garrido & Pedro J. Amado Instituto de Astrofísica de Andalucía, CSIC. Granada
Acoustic oscillations Angular dependence (l,m) Radial dependence (n)
1996 standard solar model inclusion of He settling & improved physics base of convection zone better physics for core needed Standard solar model
Standard solar model Differential rotation
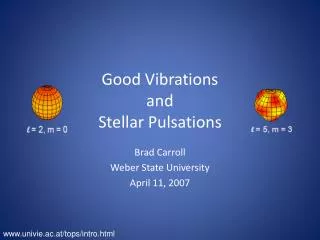
Small and large separations Solar oscillations (VIRGO-SOHO)
Asteroseismic diagram:J. C. Christensen-Daslgaard, Rev. Mod. Phys., 74, 1073
d Scuti g Doradus Variability Zoo
Giants UMa Hya GSC 09137- 03505 aBoo
LAST RESULTS WITH HARPSB. Mosser (Corot week 6: May 2004, Orsay) • A clear signature of the large separation : • Dn 89 mHz
HARPS PERFORMANCE 2 minutes integration time for V=6 on the ESO 3.6m: σv=1 ms-1@ vsini= 0 kms-1 σv=3 ms-1@ vsini=10 kms-1
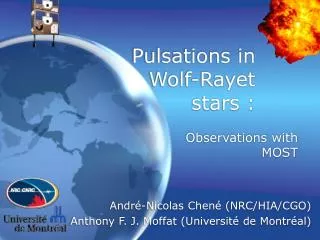
Benefits from the IR Flux gain
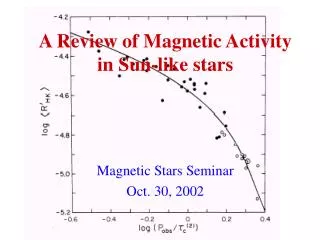
Benefits from the IR magnetic sensitivity
Problems • Theory • mode selection (amplitudes) • amplitude & phase changes • input physics in models • convection & overshooting • diffusion & settling • rotation • magnetic field • Observations • mode identification (spectroscopy & photometry) • data analysis
Active stars:Science goals • Dynamo geometry • Solar-like or something different? • Polar spots and active belts • Spot structure • Resolved or not? • Differential rotation and meridional flows • Lifetimes of individual spots and active regions • Stellar “butterfly diagrams” • Different stellar types • Pre-main sequence stars • Young main-sequence stars with[out] radiative interiors • Subgiants and giants
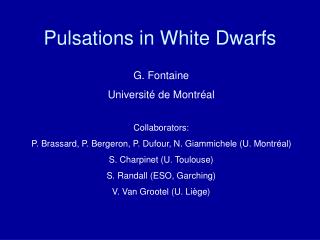
A A Intensity Intensity -v sin i v(spot) v sin i -v sin i v(spot) v sin i Doppler Imaging
Data requirements • Time-series of hi-res (R > 30000) spectra: • Good supply of unblended intermediate-strength lines (!) • Broad-band light-curves. • TiO and other temperature diagnostics.
Least-Square Deconvolution • Assume observed spectrum = mean profile convolved with depth-weighted line pattern: • De-convolve mean profile zkvia least squares: • S/N improves from ~100 to ~2500 per 3 km s–1 pixel with ~2500 lines. Depth-weighted line pattern, - KNOWN Mean profile, z (UNKNOWN) Rotationally broadened spectrum, r – KNOWN =
DI Maps AB Dor
DI Maps VW Cep
ZDI Maps AB Dor
Benefits from the IR • Spectral lines are less blended in the infrared. Hence, line profile variations are more clearly detected • The Zeeman effect is enhanced for lines in the IR • Radiation flux and pulsation amplitudes increase with increasing wavelength for cooler stars. • IR lines can probe different parts of the atmosphere.
Benefits from the IR • Sun continuum contrast between photosphere and Tspot =4250 K: • ≈ 20% @ 0.6 µm • ≈ 70% @ 2.2 µm • Resolving the telluric absorption lines (intrinsically narrow ~5 km s−1) Pontoppidan & van Dishoeck, 2004, astroph 0405629 • Zeeman sensitivity: the Fe I line at 1.56 µm splits by twice the FWHM in 1.5 kG fields (slowly rotating stars): 2-3 times more sensitive than optical lines (Giampapa PASP 109)