Download
1 / 9
90 likes | 182 Views
The Scientific Method:. the steps you follow to do an experiment. A flipbook of the inquiry process!. 1. IDENTIFY A PROBLEM. Always a question! Two acceptable formats: What is the effect of IV on DV ? How does IV affect DV ?

E N D
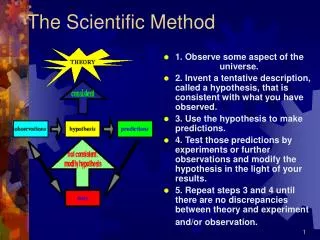
The Scientific Method: the steps you follow to do an experiment A flipbook of the inquiry process!
1. IDENTIFY A PROBLEM • Always a question! • Two acceptable formats: • What is the effect of IV on DV? • How does IV affect DV? • INDEPENDENT VARIABLE = the part the experimenter purposely changes! • DEPENDENT VARIABLE = the part the experimenter measures/records • HAS to be answered by an experiment! • CAN NOT be answered by “yes” or “no”!
2. RESEARCH • Gather information on the topic • Specifically, look for background information about the VARIABLES! • Use a variety of sources • websites • Books • Magazines • encyclopedias, etc. • Cite the sources properly (check with your science or language arts teacher!)
3. WRITE A HYPOTHESIS • The “educated guess” • Educated because it is based on the research! • It is a prediction of what the results of the experiment will be • ONE acceptable format: • If (insert information about what will be done to the IV), then (insert your prediction of what will happen to the DV). • Must be a statement that can be tested!
4.PLAN & CONDUCT THE EXPERIMENT (Procedures) • List the DETAILED steps to follow • Include sizes, measurements, HOW to do each step….include pictures if necessary! • Make sure it is CONTROLLED • Has ONE independent variable • Has THREE levels of the IV • Has THREE trials • Create a materials list • NOW, follow the procedures!
5. COLLECT DATA & OBSERVATIONS • Write down everything you see, notice, or measure • Include QUALITATIVE (parts you describe with your senses & words!) DATA • Include QUANTITATIVE (parts you measure, time, count, etc that you record with numbers!) DATA • Put everything into chart form (data table)
6. ANALYZE DATA & OBSERVATIONS • Put the quantitative data into GRAPH form • Choose the appropriate graph (bar, line, etc) • Create a RESULTS paragraph. Include: • What was learned from the charts & graphs • What does the graph represent? • What are some interesting features about the data? • What does the graph/data show? Summarize it in words & explain any trends. • Is the hypothesis supported or denied? Why?
7. MAKE CONCLUSIONS • Summarize the WHOLE experiment in a QUALITY PARAGRAPH! Include: • Restate the problem • State the MAJOR findings of the experiment (what is the answer to the problem?) • Tell if the hypothesis was SUPPORTED or DENIED. Explain why. • Rewrite a hypothesis based on the experimental results
7. MAKE CONCLUSIONS (cont.) • Compare the original (book) and experimental research. Explain similarities & differences • Explain sources of error. What went wrong? What affected the results? • Make recommendations for future research. (Write a NEW problem to experiment with in order to get more information on the topic) • Explain the impact on the scientific community (why would others care about what was learned?)