Download
1 / 32
330 likes | 670 Views
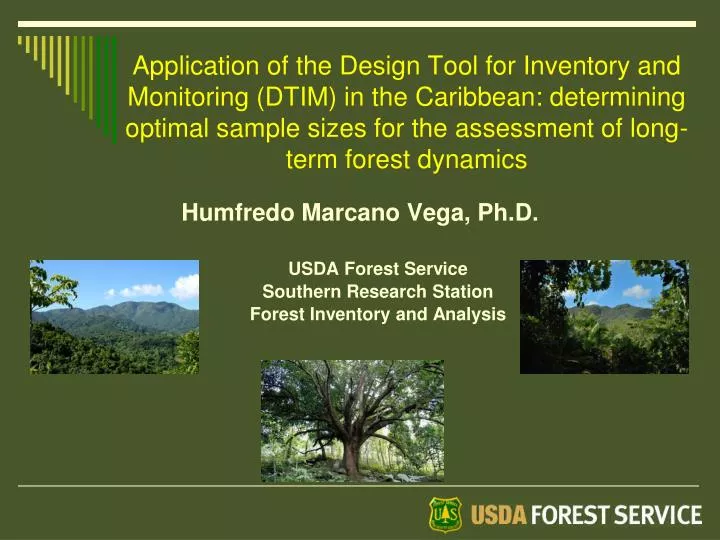
Humfredo Marcano Vega, Ph.D . USDA Forest Service Southern Research Station Forest Inventory and Analysis. Application of the Design Tool for Inventory and Monitoring (DTIM) in the Caribbean: determining optimal sample sizes for the assessment of long-term forest dynamics. Monitoring Toolkit.

E N D
Humfredo Marcano Vega, Ph.D. USDA Forest Service Southern Research Station Forest Inventory and Analysis Application of the Design Tool for Inventory and Monitoring (DTIM) in the Caribbean: determining optimal sample sizes for the assessment of long-term forest dynamics
Monitoring Toolkit • Sample Size Tool • Explore Sample Data Tool • Design Tool for Inventory and Monitoring (DTIM) • Forest Resource Inventory, Edit, and Design (FRIED) Tool
Populations and samples Total Volume? Census? Sample? How many?
Appropriate Sampling Unit/Plot Design • Shape? • Size? • Number? • Spatial arrangement (distance)?
Sampling design • Simple random? • Systematic? • Statifiedrandom? • Cluster?
Monitoring Toolkit The Planning Tool could help with monitoring steps: Set broad objectives Set specific objectives Select attributes Set time/cost and precision constraints Assemble and evaluate existing data Select sampling and plot designs
Planning Tool Tables Questions Tables Identifymetrics (data) youneedtocollect in thefield and fillthetables Objetives Questions Tables Questions Objetives Tables Questions Tables Tables of estimates and samplingerrorsfortheenhancement of ouranalysis and interpretation of forestdynamics and management Field Manual
Planning Tool • TheDesignToolforInventory and Monitoring (DTIM) assistsyou in meeting yourforestinformationneedsfollowingtheprinciple of: • Selectingthelowestnumber of plotsneededtoaccomplish a precisionrequirement • A precision requirement can be that we want to be 95% confident that the density estimates of mahogany are within 10% of the true mean density value
Set broad objectives – determine Desired Forest Conditions or Outcomes and develop Key Monitoring Questions
Set specific objectives – assigning broad objectives to our key questions Objectives tab
Set specific objectives – assigning broad objectives to our key questions Objectives tab
Set specific objectives – pick from a list of objectives based on your key questions Questions tab
Set specific objectives – pick from a list of objectives based on your key questions Questions tab
Set specific objectives – pick from a list of objectives based on your key questions Questions tab
Select attributes – tool lists the attributes (metrics) needed to make tables to answer the questions (Metrics tab)
Select attributes – tool lists the attributes (metrics) needed to make tables to answer the questions (Metrics tab)
Set time/cost and precision constraints – enter local data. Specify precision for key attributes • Describe results with precision indexes (sampling error or confidence interval) • Give a notion of what is the confidence and precision of our sample estimates when they are evaluated/ interpreted • Don’t produce estimates without also stating their reliability
Set time/cost and precision constraints – enter local data. Specify precision for key attributes • Example: We are 95% confident that the mahogany basal area (m2/ha) mean estimates are within 10% of the “true” mahogany basal area mean in the subtropical moist forest.
Set time/cost and precision constraints – enter local data. Specify precision for key attributes • Expected precision from our results? • What decisions or analysis are we going to make with the information? • What are the implications of an incorrect decision or interpretation? • At what spatial scale we want to implement management?
2 æ ö t CV% ç ÷ n = E% è ø Set time/cost and precision constraints – enter local data. Specify precision for key attributes • n= RequiredSampleSize • t = Student’st distribution value • CV = Coefficient of Variation • Standard deviation /Observed mean (%) • From previous work or guesswork • E = Expectedsampling error (%)
2 æ ö t CV% ç ÷ n = E% è ø Set time/cost and precision constraints – enter local data. Specify precision for key attributes Central Limit Theorem: As sample size increases, the means of samples drawn from a population with any shape of distribution will approach the normal distribution
Assemble and evaluate existing data (Precision tab)
Assemble and evaluate existing data (Precision tab)
Select sampling and plot designs – balance cost and precision in order to address monitoring questions • Usually an iterative process of trying to achieve the highest desired precision estimates while staying within our sampling budget • Optimize: • Precision for fixed cost • Cost for fixed precision
Acknowledgements Andrew Lister, USDA Forest Service, Northern Research Station (NRS) National Inventory and Monitoring Applications Center (NIMAC), alister@fe.fed.us Charles T. Scott, USDA Forest Service, NRS, NIMAC ctscott@fs.fed.us Kevin A. Megown, USDA Forest Service, Remote Sensing Applications Center (RSAC) kamegown@fs.fed.us