Download
1 / 67
670 likes | 892 Views
Nonrenewable Energy. Chapter 15. 15-1 What Major Sources of Energy Do We Use?. Concept 15-1A About three-quarters of the world’s commercial energy comes from nonrenewable fossil fuels and the rest comes from nonrenewable nuclear fuel and renewable sources.

E N D
Nonrenewable Energy Chapter 15
15-1 What Major Sources of Energy Do We Use? • Concept 15-1A About three-quarters of the world’s commercial energy comes from nonrenewable fossil fuels and the rest comes from nonrenewable nuclear fuel and renewable sources. • Concept 15-1B Net energy is the amount of high-quality usable energy available from a resource after the amount of energy needed to make it available is subtracted.
How Long Will the Oil Party Last? • Saudi Arabia could supply the world with oil for about 10 years. • The Alaska’s North Slope could meet the world oil demand for 6 months (U.S.: 3 years). • Alaska’s Arctic National Wildlife Refuge would meet the world demand for 1-5 months (U.S.: 7-25 months).
How Long Will the Oil Party Last? • We have three options: • Look for more oil. • Use or waste less oil. • Use something else. Figure 16-1
Natural Capital: Important Nonrenewable Energy Resources Fig 15-2
Commercial Energy Use by Source for the World and the United States Fig 15-3
International Energy information Click for International Energy Agency
Net Energy Ratios for Various Energy Systems over Their Estimated Lifetimes Fig 15-A
15-2 What Are the Advantages and Disadvantages of Oil? • Concept 15-2A Conventional oil is currently abundant, has a high net energy yield, and is relatively inexpensive, but using it causes air and water pollution and releases greenhouse gases to the atmosphere. • Concept 15-2B Heavy oils from oil sand and oil shale exist in potentially large supplies but have low net energy yields and higher environmental impacts than conventional oil has.
OIL • Crude oil (petroleum) is a thick liquid containing hydrocarbons that we extract from underground deposits and separate into products such as gasoline, heating oil and asphalt. • Only 35-50% can be economically recovered from a deposit. • As prices rise, about 10-25% more can be recovered from expensive secondary extraction techniques. • This lowers the net energy yield.
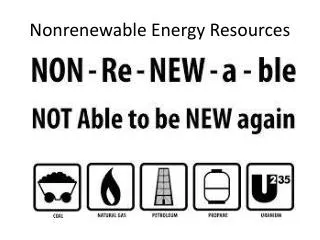
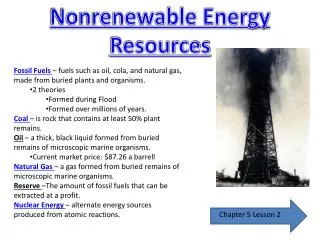
General Classification of Nonrenewable Mineral Resources • Examples are fossil fuels (coal, oil), metallic minerals (copper, iron), and nonmetallic minerals (sand, gravel).
Science: Refining Crude Oil Fig 15-4
OPEC Controls Most of the World’s Oil Supplies • Possible effects of steeply rising oil prices • Reduce energy waste • Shift to non-carbon energy sources • Higher prices for products made with petrochemicals • Higher food prices; buy locally-produced food • Airfares higher • Smaller more fuel-efficient vehicles • Upgrade of public transportation
Energy in CaliforniaForeign Source Crude Oil 2008 Click for Ca Energy Commission
OIL • Inflation-adjusted price of oil, 1950-2006. • What is the cost today? Click
U.S. oil supplies Click for EIA data
Oil in the SBC Click for SB Channel Keepers Click for SB County
Gasoline in California Click for animation: ground to car
What will motor vehicle fuel cost in the future? Annual Energy Outlook 2008 with Projections to 2030 Source: EIA: http://www.eia.doe.gov/oiaf/aeo/gas.html
Trade-Offs: Conventional Oil, Advantages and Disadvantages Fig 15-6
15-3 What Are the Advantages and Disadvantages of Natural Gas? • Concept 15-3 Conventional natural gas is more plentiful than oil, has a high net energy yield and a fairly low cost, and has the lowest environmental impact of all fossil fuels.
How does natural gas get to your home? Click for EIA report
NATURAL GAS • Russia and Iran have almost half of the world’s reserves of conventional gas, and global reserves should last 62-125 years. • Natural gas is versatile and clean-burning fuel, but it releases the greenhouse gases carbon dioxide (when burned) and methane (from leaks) into the troposphere.
Liquified Natural Gas Click for EIA report
Shale Natural Gas continued • Prices of Natural Gas have dropped: unit = 1000 cubic feet • 90s = $2, 2005 = $15, 2010 = $3.50 • Shale Gas reserves increased 50 % from 2007 to 2008 with 30% of this in Texas • Project $4/1000 cubic feet for next 80 years • Low Price Making Wind and Nuke investment slow or stop • Concerns about Groundwater Pollution
Shale Natural Gas and Groundwater Many cases of water contamination from shale gas drilling operations, which use high-volume hydraulic fracturing (HVHF), exist: Thousands of problems, including spills, leaks, and the seepage of contaminants into drinking water supplies, have been documented around the country in conjunction with shale gas extraction by HVHF. ► Houses, water wells, and pipelines have exploded, and people have found methane levels in their water so high that they could light it on fire with a match. No studies have demonstrated that gas extraction operations using HVHF do not cause water contamination: In 2010, both the EPA and the House Committee on Energy and Commerce under Senator Waxman initiated major studies on the health and environmental impacts of hydraulic fracturing. Hydrofracking is not an exact science: When gas companies fracture the shale, they do not have complete control over where fractures will develop, so fracturing fluids and natural gas can move in unexpected directions,ending up in aquifers and water wells. Vast numbers of uncapped gas wells threaten aquifers and drinking wells: 18,000 to 48,000 abandoned oil and gas wells that have not been capped exist in NY. During hydrofracking and deep-well injection, the high pressure can force the toxic fluids up through any existing uncapped wells, contaminating aquifers and drinking wells. The process itself is not a problem. We know how to do these things correctly; we know how to do the job right … But there’s a lot of operators who aren’t doing it right.” Ron Nelson, a retired BP Amoco geologist . From Houston Business Journal, Oct 11, 2010.
Trade-Offs: Conventional Natural Gas Fig 15-10
15-4 What Are the Advantages and Disadvantages of Coal? • Concept 15-4A Conventional coal is very plentiful and has a high net energy yield and low cost, but it has a very high environmental impact. • Concept 15-4B Gaseous and liquid fuels produced from coal could be plentiful, but they have lower net energy yields and higher environmental impacts than conventional coal has.
COAL • Coal reserves in the United States, Russia, and China could last hundreds to over a thousand years. • The U.S. has 27% of the world’s proven coal reserves, followed by Russia (17%), and China (13%). • In 2005, China and the U.S. accounted for 53% of the global coal consumption. • Burned in 2100 power plants, generates 40% of the world’s electricity
Science: Coal-Burning Power Plant Fig 15-12
Electricity production in U.S. Click of EIA report
COAL • Coal can be converted into synthetic natural gas (SNG or syngas) and liquid fuels (such as methanol or synthetic gasoline) that burn cleaner than coal. • Costs are high. • Burning them adds more CO2 to the troposphere than burning coal. • Reduces net energy
Coal Gasification Click for DOE project info
Carbon Dioxide Sequestration Click for DOE info
Coal Sequestration Costs • To sequester carbon dioxide will cost $25 per ton of carbon dioxide for a combined cycle plant. ($50 per ton of carbon dioxide for a traditional steam powered plant.) • This will increase the cost of producing coal 300% to $60 per ton of coal. • The power plant that burns the coal to make electricity would face a 50% rise in the cost of producing the electricity. This is around 2 cents/kW-hr. • The homeowner buying only coal produced electricity (at 10 Cents/kW-hr) will see a 20% increase (10 cents to 12 cents/kW-hr) in their power bill. • These estimates are from Scientific American, pp 52, July 2005
CO2 Emissions Per Unit of Electrical Energy Produced for Energy Sources Fig 15-14