Download
1 / 30
300 likes | 391 Views
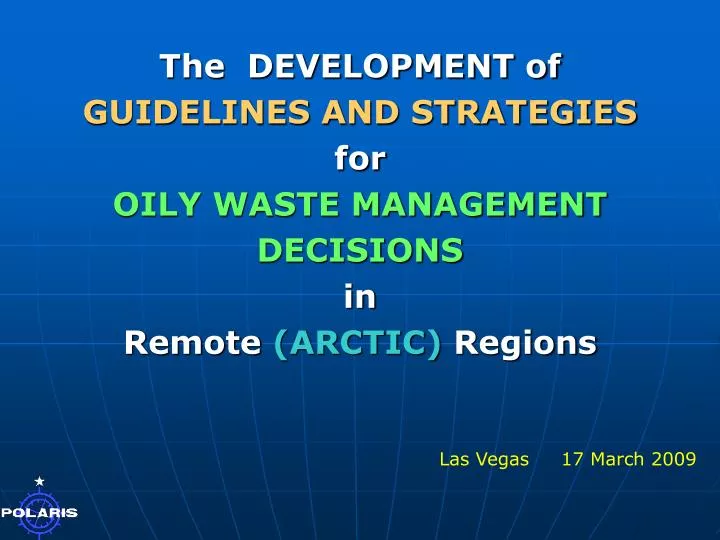
The DEVELOPMENT of GUIDELINES AND STRATEGIES for OILY WASTE MANAGEMENT DECISIONS in Remote (ARCTIC) Regions. Las Vegas 17 March 2009. PROJECT STATUS. Waste Guidelines and Strategies 1. Technical Report – text completion 24 th April (only Appendix E left)

E N D
The DEVELOPMENT of GUIDELINES AND STRATEGIES for OILY WASTE MANAGEMENT DECISIONS in Remote (ARCTIC) Regions Las Vegas 17 March 2009
PROJECT STATUS Waste Guidelines and Strategies 1.TechnicalReport – text completion 24th April (only Appendix E left) 2. Waste Management Calculator completed – software will be available 1st May 2009 • User’s Guide – completed All three deliverables will be submitted to Canadian HoD for submission to the EPPR Chair for presentation to the Arctic Council Minster’s Meeting in Tromsø on 27th April 2009
Contents • Project Objectives • Project History • Oil Spill Waste Management Report • Decision Job Aid (“Waste Management Calculator ”)
1. OBJECTIVES • Develop guidelines and recommendations for decisions regarding shoreline treatment in remote (Arctic) regions. • Provide decision makers and planners with relevant information regarding potential waste generation, waste types, and waste volumes upon which they can set the response objectives. • Complete in April 2009.
2. Project History • Report prepared on “Guidelines and Strategies for Oil Spill Waste Management in Arctic Regions” • The conclusions and results were then used to develop a software tool - “Waste Management Calculator” – as a job aid for decision makers and planners
3. TECHNICAL REPORT The report was prepared for the EPPR Working Group of the Arctic Council under the direction of the Joint Secretariat, with funding from the governments of Canada, Norway and the US.
Key Report Sections Decision Process: • Waste Generation • Waste Types • Waste Volumes What happens to the Waste: • Waste Handling • Secondary Processing and Packaging • Waste Transfer and Transport
Key Report Sections • Recommended Contents of a Waste Management Plan • Waste Management Calculator Job Aid Appendix A - Waste Generation Data from Shoreline Treatment Operations Appendix D - Legislation Summary for Arctic Canada(5 levels of government: Inuvialuit – Federal – Northwest Territories – Yukon – Nunavut) Appendix E - Legislation Summary for Norway (to be completed by 24th April)
Key Conclusions • Volume of waste generated by a response operation is a function of management decisions, not of the volume of the spill. • Waste transfer depends on boats and helicopters. • “Traditional” shoreline cleanup methods generatehundreds and even thousands m3/km. • In Situ shoreline treatment can be effective and generates very little waste.
a. Spill Volume vs Waste Volume The volumes and types of waste generated by oil spill response activities are NOT a function of the size of the spill, nor the location, but rather are a direct function of decision made by the spill management team with respect to: • the response objectives, • the treatment endpoints and • the response methods.
No Relationship between Spill Volume and Waste Generated
Waste Types • In 7 of the 10 cases (that is, except for the Haven, Sea Empress, and Prestige) the solid waste component was more than 95% of the wastes that were generated.
b. Waste Transfer Typical Model Intermediate storage Intermediate storage Long Term Storage SEA site 6 site 5 Primary storage Transport site 4 site 3 site 2 Transport site 1 ELIMINATIONand FINAL DISPOSAL TREATMENT Transfer
Model Must be Modified for Remote Area Operations • No roads • Transfers will be either by - tracked vehicle, - boat (barge, landing craft), or - helicopter.
Remote Area Logistics Costs Minimum long-term charter rates in northern North America for single-engine helicopters : • between $3,000 and $5,000 USD/day (ex. fuel) • more than $10,000 USD/day for twin-engine craft • larger helicopters (S-92 or Boeing Chinook) up to $50,000 USD/day plus fuel. Barge costs - 100,000 bbl oil-certified barge and tug combination approx. $20,000 to $24,000 USD/day plus fuel - fuel costs for transport underway typically double the day rate.
c. Waste Generation Data • Very little data exist on volumes of waste generated by shoreline treatment or cleanup except as gross totals. • Two maximum volumes for specific individual shoreline segments of mixed sand, pebble, cobble sediments: - Mechanical removal: 4,000 m3/km (1.3 m3/m2) - Manual removal: 2,500 m3/km (1.4 m3/m2) • In both cases, treatment end points required removal of almost all of the oiled sediments.
d. Shoreline Treatment Options The preferred options are in situtechniques as these do not generate oil or oily wastes, only operational or logistics waste materials: • Natural recovery • Mixing • Sediment Relocation • Burning, and • Bioremediation.
Shoreline Treatment Options These In situ treatment options are particularly attractive for remote area operations where waste may have to be transferred by boat or helicopter and transported long distances for recycling or final disposal.
4. “Waste Management Calculator ”Shoreline Treatment Decision Job Aid
4.“Waste Management Calculator ” The tool was developed jointly between Polaris Applied Sciences, Inc. and The Oil Spill Training Company Ltd. for the EPPR Working Group of the Arctic Council, under the direction of the Joint Secretariat with funding from the governments of Canada, Norway and the USA.
4.“Waste Management Calculator ” Developed to assist decision makers and planners by indicating the consequences of different decisions with respect four key inputs: • Shoreline Types, • Oil Types, • Degree of Oiling, and • Shoreline Length (optional).
4.“Waste Management Calculator ” Provides three key outputs: • Preferred Shoreline Treatment Options, • Oily Waste Volumes, and • Waste Types.
CALCULATIONS Included: • A 3-way matrix for: - substrate type (7) - degree of oiling (5) - treatment option (7) • Separate matrices for the 5 oil types • Separate sets of matrices for the 2 treatment end points.
CALCULATIONS One of 10 matrices developed from the calculations • specific volumes estimates generated by each calculation • colours correspond to waste volume category
Case Study Data all Medium or Heavy oil types
STATUS Waste Guidelines and Strategies 1.Report – text - (only Appendix E to do) 2. Waste Management Calculator completed – software will be available 1st May 2009 * • User’s Guide – completed All three deliverables will be submitted to Canadian HoD for submission to the EPPR Chair for presentation to the Arctic Council Minster’s Meeting in Tromsø on 27th April 2009 * a download from www.oilspilltraining.com