Download
1 / 14
140 likes | 152 Views
Explore a step-by-step guide on utilizing ESPON WEB GIS to analyze accessibility and territorial cohesion in relation to female population density in Coastal NUTS 2 areas with over 700,000 inhabitants. Learn to search the geodatabase, select appropriate indicators, and conduct advanced spatial analysis. Dive into ESDA to study the spatial distribution of lagging regions and examine the relation between GDP and accessibility. Discover new insights on accessibility patterns and regional development.

E N D
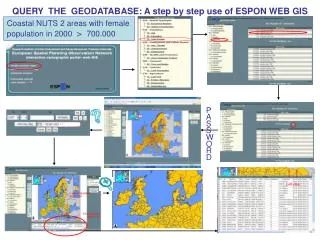
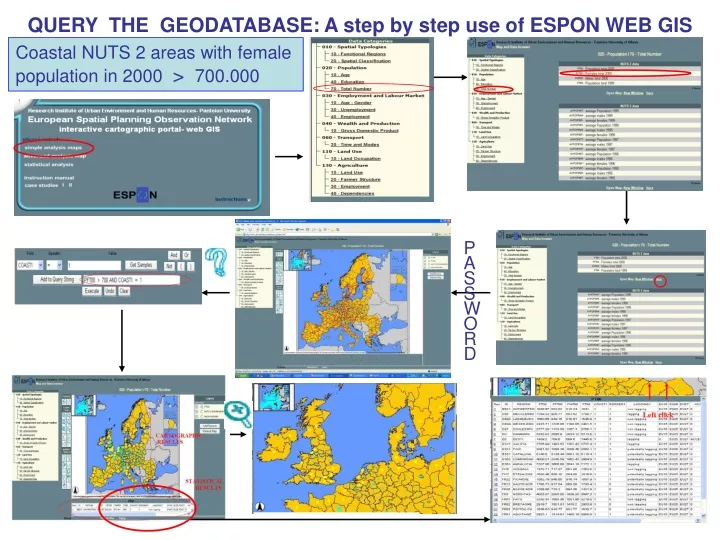
QUERY THE GEODATABASE: A step by step use of ESPON WEB GIS Coastal NUTS 2 areas with female population in 2000 > 700.000 P A S S W O R D
Searching the Data Base to select the appropriate data/indicators Selection of Data Navigator subcategory Transport →Time & Modes Selection of indicator Metadata and/or documentation from TPG’s reports. Indicator: gdp1000ttmTime to market by road, half life macroscale (1000) weighted by GDP. Using ESPON WEB GIS for SPATIAL ANALYSIS STUDY THE ACCESSIBILITYin relation to TERRITORIAL COHESION sa • Data are organized in Data Navigator (Sub) Categories. • Each (sub) category corresponds to one predefined map (Simple Analysis Environment). • Simultaneously examination of data from different subcategories are aloud only in Advance Analysis Environment. Step1 : Searching the GeoDataBase UEHR
c a b d Step 2: Statistical Analysis environment EDA (Exploratory non spatial Data Analysis) of the selected indicator UEHR
Step 3: Advanced Analysis Map environment ESDA (Exploratory Spatial Data Analysis)
Step 3: Advanced Analysis Map environment ESDA a: Selection – Add layers
Step 3: Advanced Analysis Map environment ESDA b: Spatial distribution of the areas with values of accessibility (GDT1000TTM) over the mean value
Step 3: Advanced Analysis Map environment ESDA c:Study the spatial distribution of a new indicator LAGGING REGIONS
Step 3: Advanced Analysis Map environment ESDA d: Study the spatial relation GDP1000TTM + LAGGING REGIONS Mean for lagging regions
Mainly new countries Average accessibility 1542,7 Richest Lagging Areas Step 3: Advanced Analysis Map environment ESDA e:Lagging Regions with Accessibility (GDP1000TTM) up to the average of the Lagging Regions
New Pentagon ? Step 3: Advanced Analysis Map environment ESDA f:Lagging Regions with Accessibility (GDP1000TTM) up to the average of the “Richest Lagging Areas”