Download
1 / 98
1.04k likes | 1.36k Views
Electrocardiography. Saeed Oraii MD, Cardiologist Interventional Electrophysiologist Tehran Arrhythmia Clinic. Some slides have accompanied notes. To view them you can right click on the screen, choose ‘Screen’ and then ‘Speaker Notes’. ECG.

E N D
Electrocardiography Saeed Oraii MD, Cardiologist Interventional Electrophysiologist Tehran Arrhythmia Clinic
Some slides have accompanied notes. To view them you can right click on the screen, choose ‘Screen’ and then ‘Speaker Notes’. Tehran Arrhythmia Center
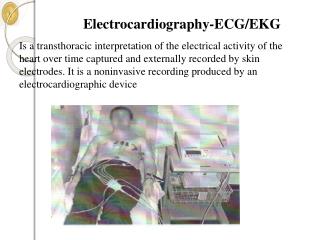
ECG A graphic recording of electrical potentials generated by the heart A noninvasive, inexpensive and highly versatile test Tehran Arrhythmia Center
Normal Pathway of Electrical Conduction Tehran Arrhythmia Center
Normal Impulse Conduction Sinoatrial node AV node Bundle of His Bundle Branches Purkinje fibers Tehran Arrhythmia Center
Cardiac Action Potential Tehran Arrhythmia Center
Cardiac action potentials from different locations have different shapes Tehran Arrhythmia Center
Electrophysiology • Electric currents that spread through the heart are produced by three components • Cardiac pacemaker cells • Specialized conduction tissue • The heart muscle • ECG only records the depolarization and repolarization potentials generated by atrial and ventricular myocardium. Tehran Arrhythmia Center
Electrocardiograph 1903 Tehran Arrhythmia Center
Normal Electrocardiogram Tehran Arrhythmia Center
ECG Waveforms Labeled alphabetically beginning with the P wave Tehran Arrhythmia Center
The “PQRST” • P wave - Atrialdepolarization • QRS- Ventricular depolarization • T wave- Ventricular repolarization Tehran Arrhythmia Center
QRS-T Cycle Corresponds to Different Phases of Ventricular Action Potential Tehran Arrhythmia Center
The PR Interval Atrial depolarization + delay in AV junction (AV node/Bundle of His) (delay allows time for the atria to contract before the ventricles contract) Tehran Arrhythmia Center
Impulse Conduction & the ECG Sinoatrial node AV node Bundle of His Bundle Branches Purkinje fibers Tehran Arrhythmia Center
Limb Leads Tehran Arrhythmia Center
Precordial Leads Tehran Arrhythmia Center
Position of Precordial Electrodes Tehran Arrhythmia Center
Precordial Leads Tehran Arrhythmia Center
3-D Representation of Cardiac Electrical Activity Tehran Arrhythmia Center
Vector Concept • Cardiac depolarization and repolarization waves have direction and magnitude. • They can, therefore, be represented by vectors. • ECG records the complex spatial and temporal summation of electrical potentials from multiple myocardial fibers conducted to the surface of the body. Tehran Arrhythmia Center
Limb Leads Directions Tehran Arrhythmia Center
Vector Concept Tehran Arrhythmia Center
Ventricular Depolarization Septal q wave Tehran Arrhythmia Center
QRS Axis Tehran Arrhythmia Center
Determination of QRS Axis Tehran Arrhythmia Center
Direction of Propagation Tehran Arrhythmia Center
Determination of QRS Axis Tehran Arrhythmia Center
Determination of QRS Axis Tehran Arrhythmia Center
Main Vector Tehran Arrhythmia Center
Normal QRS Axis Tehran Arrhythmia Center
Left Axis Deviation Tehran Arrhythmia Center
Right Axis Deviation Tehran Arrhythmia Center
Timing Intervals Tehran Arrhythmia Center
The ECG Paper • Horizontally • One small box - 0.04 s • One large box - 0.20 s • Vertically • One large box - 0.5 mV Tehran Arrhythmia Center
The ECG Paper 3 sec 3 sec • Every 3 seconds (15 large boxes) is marked by a vertical line. • This helps when calculating the heart rate. Tehran Arrhythmia Center
Major ECG Abnormalities Tehran Arrhythmia Center
Right Atrial Enlargement P Pulmonale, Amplitude ≥ 2.5 mm Tehran Arrhythmia Center
Right Atrial Enlargement The P waves are tall, especially in leads II, III and avF. Tehran Arrhythmia Center
Right Atrial Enlargement • To diagnose RAE you can use the following criteria: • II P > 2.5 mm, or • V1 or V2 P > 1.5 mm > 1 ½ boxes (in height) Remember 1 small box in height = 1 mm > 2 ½ boxes (in height) A cause of RAE is RVH from pulmonary hypertension, hence P Pulmonale. Tehran Arrhythmia Center
Left Atrial Enlargement P Mitrale, Duration ≥ 120 ms Tehran Arrhythmia Center
Notched Negative deflection Left Atrial Enlargement The P waves in lead II are notched and in lead V1 they have a deep and wide negative component. Tehran Arrhythmia Center
Left Atrial Enlargement • To diagnose LAE you can use the following criteria: • II > 0.04 s (1 box) between notched peaks, or • V1 Neg. deflection > 1 box wide x 1 box deep Normal LAE A common cause of LAE has been Mitral Stenosis, hence P Mitrale. Tehran Arrhythmia Center
Increased QRS voltage Left Ventricular Hypertrophy Why is left ventricular hypertrophy characterized by tall QRS complexes? As the heart muscle wall thickens there is an increase in electrical forces moving through the myocardium resulting in increased QRS voltage. LVH Echocardiogram Tehran Arrhythmia Center
Left Ventricular Hypertrophy Tehran Arrhythmia Center
Left Ventricular Hypertrophy Compare these two 12-lead ECGs. What stands out as different with the second one? Normal Left Ventricular Hypertrophy Answer: The QRS complexes are very tall (increased voltage) Tehran Arrhythmia Center
Left Ventricular Hypertrophy • Criteria exists to diagnose LVH using a 12-lead ECG. • For example: • The R wave in V5 or V6 plus the S wave in V1 or V2 exceeds 35 mm. Tehran Arrhythmia Center
Right Ventricular Hypertrophy Tehran Arrhythmia Center
Right Ventricular Hypertrophy • Compare the R waves in V1, V2 from a normal ECG and one from a person with RVH. • Notice the R wave is normally small in V1, V2 because the right ventricle does not have a lot of muscle mass. • But in the hypertrophied right ventricle the R wave is tall in V1, V2. Normal RVH Tehran Arrhythmia Center
Right Ventricular Hypertrophy To diagnose RVH you can use the following criteria: • Right axis deviation, and • V1 R wave > 7mm tall Tehran Arrhythmia Center