Download
1 / 7
70 likes | 155 Views
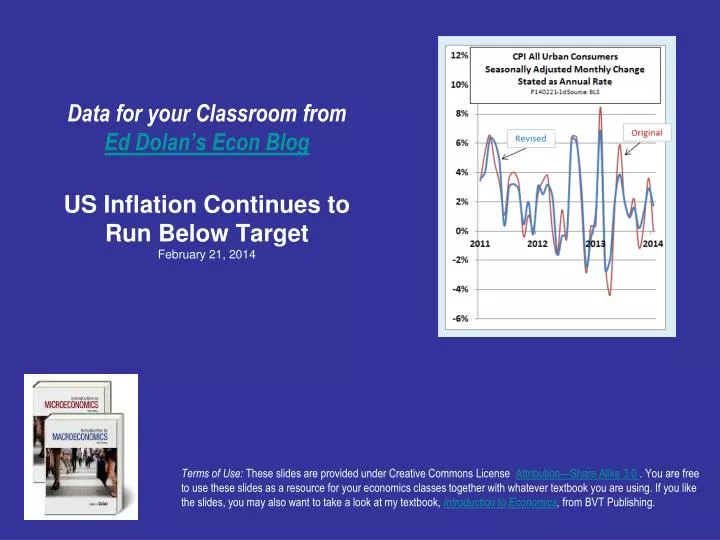
Data for your Classroom from Ed Dolan’s Econ Blog US Inflation Continues to Run Below Target February 21, 2014.

E N D
Data for your Classroom fromEd Dolan’s Econ BlogUS Inflation Continues to Run Below TargetFebruary 21, 2014 Terms of Use: These slides are provided under Creative Commons License Attribution—Share Alike 3.0 . You are free to use these slides as a resource for your economics classes together with whatever textbook you are using. If you like the slides, you may also want to take a look at my textbook, Introduction to Economics, from BVT Publishing.
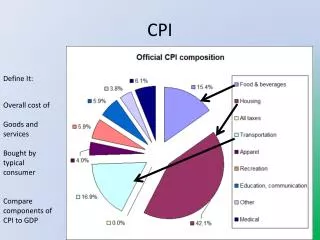
CPI Inflation Continues to Run Below Target • The US consumer price index rose at a seasonally adjusted annual rate of 1.75 percent in January, 2014 • Over the past two years, inflation has trended downward • The January rate was well below the Fed’s 2 percent inflation target Posted February 21, 2014 on Ed Dolan’s Econ Blog http://dolanecon.blogspot.com
The Role of Seasonal Adjustment • Monthly data is often seasonally adjusted to remove the effects of price changes that happen at predictable times of year, such as higher gasoline prices in the summer driving season • From time to time, the BLS updates its seasonal adjustment factors • Newly revised adjustment factors show less month-to-month volatility in the seasonally adjusted CPI, compare with previously released data Posted February 21, 2014 on Ed Dolan’s Econ Blog http://dolanecon.blogspot.com
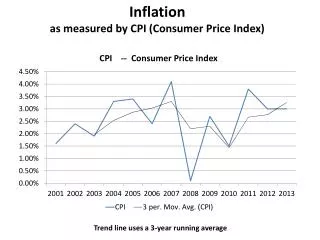
Year-on-year inflation is also trending down • Another way to eliminate seasonal factors is to look at year-on-year changes in the CPI • This chart shows both the all-items CPI and also the core CPI, which removes volatile food and energy prices • Both inflation rates have trended down over the past two years Posted February 21, 2014 on Ed Dolan’s Econ Blog http://dolanecon.blogspot.com
Expected Inflation • The Cleveland Fed uses the prices of Treasury Inflation-Protected Securities to estimate the rates of inflation expected by participants in financial markets • In mid-2013, expected inflation rates began to rise • Since late summer, expected inflation has leveled out, and remains well below the Fed’s 2 percent target Posted February 21, 2014 on Ed Dolan’s Econ Blog http://dolanecon.blogspot.com
The Bottom Line The bottom line: Despite the gradually strengthening recovery, an upside outbreak of inflation remains among the least significant risks facing the U.S. economy Posted February 21, 2014 on Ed Dolan’s Econ Blog http://dolanecon.blogspot.com Trimmed mean All Items
For more slideshows, followEd Dolan’s Econ Blog Follow @DolanEconon Twitter Click here to learn more about Ed Dolan’s Econ texts or visit www.bvtpublishing.com