Download
1 / 1
20 likes | 154 Views
Purpose: "A model of light transport can be used to predict the reflectance of tissue based on its composition. The inverse process whereby composition is deduced from reflectance measurements is investigated as an aid in interpreting fundus images."

E N D
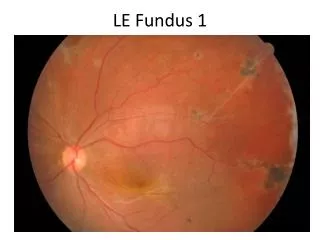
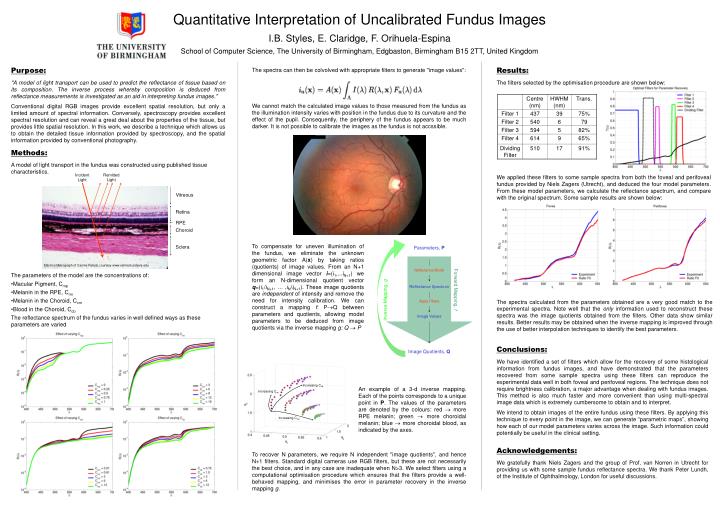
Purpose: "A model of light transport can be used to predict the reflectance of tissue based on its composition. The inverse process whereby composition is deduced from reflectance measurements is investigated as an aid in interpreting fundus images." Conventional digital RGB images provide excellent spatial resolution, but only a limited amount of spectral information. Conversely, spectroscopy provides excellent spectral resolution and can reveal a great deal about the properties of the tissue, but provides little spatial resolution. In this work, we describe a technique which allows us to obtain the detailed tissue information provided by spectroscopy, and the spatial information provided by conventional photography. Results: The filters selected by the optimisation procedure are shown below: Centre (nm) HWHM (nm) Trans. Filter 1 437 39 75% Filter 2 540 6 79 Filter 3 594 5 82% Filter 4 614 9 65% Methods: A model of light transport in the fundus was constructed using published tissue characteristics. Dividing Filter 510 17 91% We applied these filters to some sample spectra from both the foveal and perifoveal fundus provided by Niels Zagers (Utrecht), and deduced the four model parameters. From these model parameters, we calculate the reflectance spectrum, and compare with the original spectrum. Some sample results are shown below: Incident Light Remitted Light Vitreous Retina RPE Choroid Sclera • The parameters of the model are the concentrations of: • Macular Pigment, Cmp • Melanin in the RPE, Crm • Melanin in the Choroid, Ccm • Blood in the Choroid, Ccb • The reflectance spectrum of the fundus varies in well defined ways as these parameters are varied Electron Micrograph of Canine Retina, courtesy www.vetmed.ucdavis.edu The spectra calculated from the parameters obtained are a very good match to the experimental spectra. Note well that the only information used to reconstruct these spectra was the image quotients obtained from the filters. Other data show similar results. Better results may be obtained when the inverse mapping is improved through the use of better interpolation techniques to identify the best parameters. Parameters, P Increasing Ccb Reflectance Model Increasing Crm Forward Mapping, f Reflectance Spectrum Conclusions: We have identified a set of filters which allow for the recovery of some histological information from fundus images, and have demonstrated that the parameters recovered from some sample spectra using these filters can reproduce the experimental data well in both foveal and perifoveal regions. The technique does not require brightness calibration, a major advantage when dealing with fundus images. This method is also much faster and more convenient than using multi-spectral image data which is extremely cumbersome to obtain and to interpret. We intend to obtain images of the entire fundus using these filters. By applying this technique to every point in the image, we can generate “parametric maps”, showing how each of our model parameters varies across the image. Such information could potentially be useful in the clinical setting. Inverse Mapping, g Apply Filters Increasing Ccm Image Values Image Quotients, Q Acknowledgements: We gratefully thank Niels Zagers and the group of Prof. van Norren in Utrecht for providing us with some sample fundus reflectance spectra. We thank Peter Lundh, of the Institute of Ophthalmology, London for useful discussions. Quantitative Interpretation of Uncalibrated Fundus Images I.B. Styles, E. Claridge, F. Orihuela-Espina School of Computer Science, The University of Birmingham, Edgbaston, Birmingham B15 2TT, United Kingdom The spectra can then be colvolved with appropriate filters to generate "image values": We cannot match the calculated image values to those measured from the fundus as the illumination intensity varies with position in the fundus due to its curvature and the effect of the pupil. Consequently, the periphery of the fundus appears to be much darker. It is not possible to calibrate the images as the fundus is not accssible. To compensate for uneven illumination of the fundus, we eliminate the unknown geometric factor A(x) by taking ratios (quotients) of image values. From an N+1 dimensional image vector i=(i1,...iN+1) we form an N-dimensional quotient vector q=(i1/iN+1, … ,iN/iN+1). These image quotients are independent of intensity and remove the need for intensity calibration. We can construct a mapping f: PQ between parameters and quotients, allowing model parameters to be deduced from image quotients via the inverse mapping g: Q P An example of a 3-d inverse mapping. Each of the points corresponds to a unique point in P. The values of the parameters are denoted by the colours: red more RPE melanin; green more choroidal melanin; blue more choroidal blood, as indicated by the axes. To recover N parameters, we require N independent "image quotients", and hence N+1 filters. Standard digital cameras use RGB filters, but these are not necessarily the best choice, and in any case are inadequate when N>3. We select filters using a computational optimisation procedure which ensures that the filters provide a well-behaved mapping, and minimises the error in parameter recovery in the inverse mapping g.