Download
1 / 12
120 likes | 133 Views
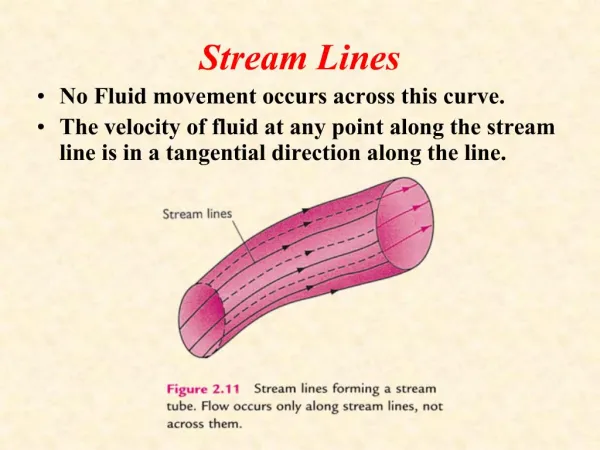
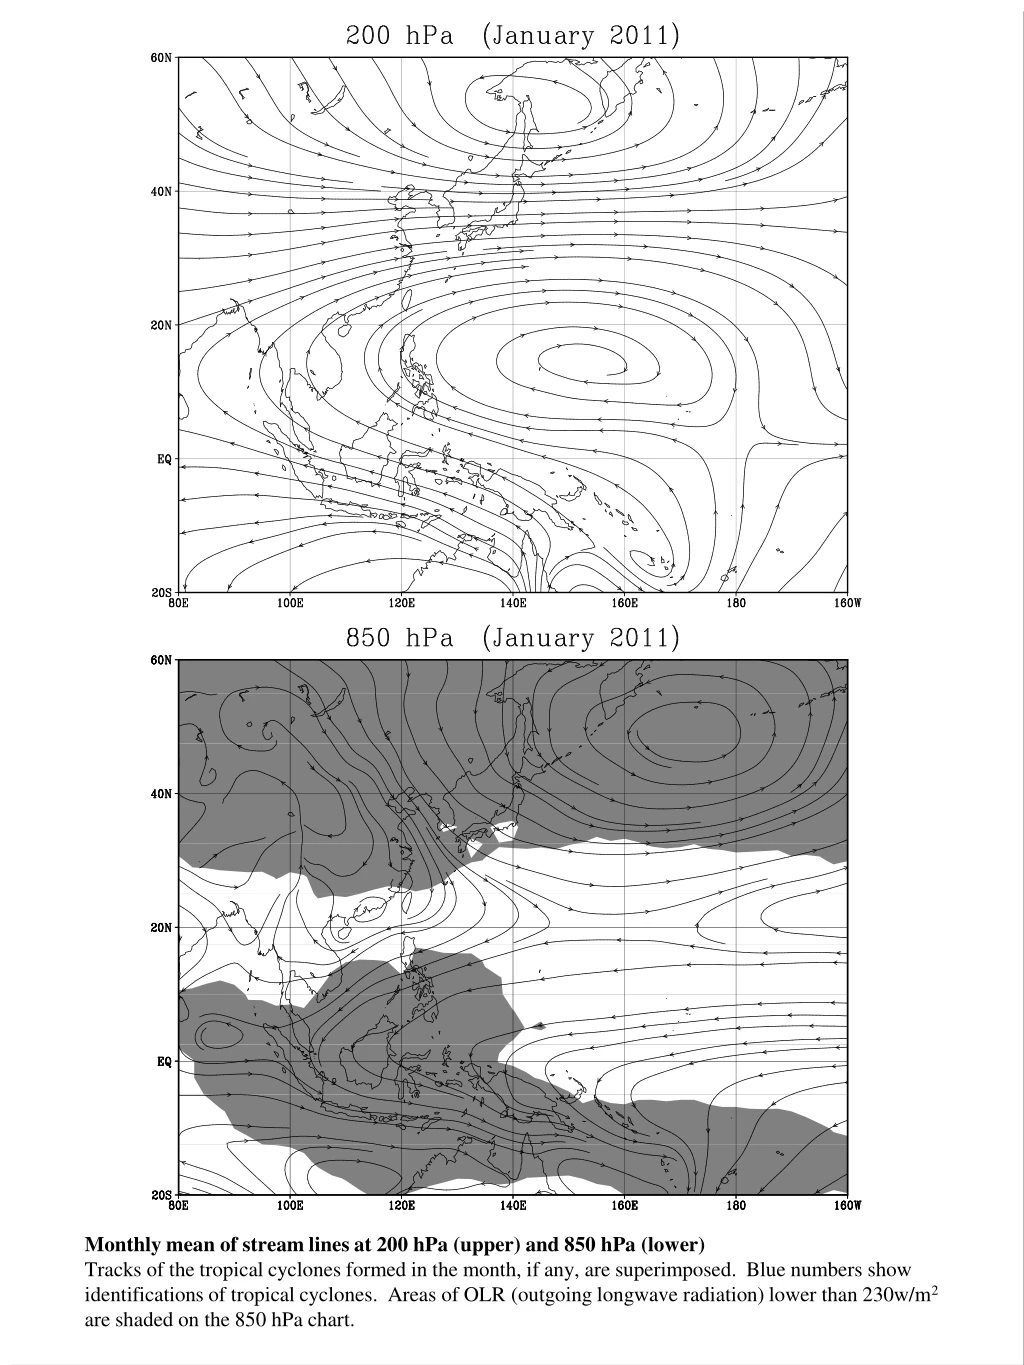
This graphic displays the monthly mean of streamline lines at 200 hPa (upper) and 850 hPa (lower) along with the tracks of any tropical cyclones formed during the month. Blue numbers indicate the identifications of tropical cyclones. Areas with outgoing longwave radiation (OLR) lower than 230 W/m2 are shaded on the 850 hPa chart.

E N D
Monthly mean of stream lines at 200 hPa (upper) and 850 hPa (lower) Tracks of the tropical cyclones formed in the month, if any, are superimposed. Blue numbers show identifications of tropical cyclones. Areas of OLR (outgoing longwave radiation) lower than 230w/m2 are shaded on the 850 hPa chart.
Monthly mean of stream lines at 200 hPa (upper) and 850 hPa (lower) Tracks of the tropical cyclones formed in the month, if any, are superimposed. Blue numbers show identifications of tropical cyclones. Areas of OLR (outgoing longwave radiation) lower than 230w/m2 are shaded on the 850 hPa chart.
Monthly mean of stream lines at 200 hPa (upper) and 850 hPa (lower) Tracks of the tropical cyclones formed in the month, if any, are superimposed. Blue numbers show identifications of tropical cyclones. Areas of OLR (outgoing longwave radiation) lower than 230w/m2 are shaded on the 850 hPa chart.
Monthly mean of stream lines at 200 hPa (upper) and 850 hPa (lower) Tracks of the tropical cyclones formed in the month, if any, are superimposed. Blue numbers show identifications of tropical cyclones. Areas of OLR (outgoing longwave radiation) lower than 230w/m2 are shaded on the 850 hPa chart.
Monthly mean of stream lines at 200 hPa (upper) and 850 hPa (lower) Tracks of the tropical cyclones formed in the month, if any, are superimposed. Blue numbers show identifications of tropical cyclones. Areas of OLR (outgoing longwave radiation) lower than 230w/m2 are shaded on the 850 hPa chart.
Monthly mean of stream lines at 200 hPa (upper) and 850 hPa (lower) Tracks of the tropical cyclones formed in the month, if any, are superimposed. Blue numbers show identifications of tropical cyclones. Areas of OLR (outgoing longwave radiation) lower than 230w/m2 are shaded on the 850 hPa chart.
Monthly mean of stream lines at 200 hPa (upper) and 850 hPa (lower) Tracks of the tropical cyclones formed in the month, if any, are superimposed. Blue numbers show identifications of tropical cyclones. Areas of OLR (outgoing longwave radiation) lower than 230w/m2 are shaded on the 850 hPa chart.
Monthly mean of stream lines at 200 hPa (upper) and 850 hPa (lower) Tracks of the tropical cyclones formed in the month, if any, are superimposed. Blue numbers show identifications of tropical cyclones. Areas of OLR (outgoing longwave radiation) lower than 230w/m2 are shaded on the 850 hPa chart.
Monthly mean of stream lines at 200 hPa (upper) and 850 hPa (lower) Tracks of the tropical cyclones formed in the month, if any, are superimposed. Blue numbers show identifications of tropical cyclones. Areas of OLR (outgoing longwave radiation) lower than 230w/m2 are shaded on the 850 hPa chart.
Monthly mean of stream lines at 200 hPa (upper) and 850 hPa (lower) Tracks of the tropical cyclones formed in the month, if any, are superimposed. Blue numbers show identifications of tropical cyclones. Areas of OLR (outgoing longwave radiation) lower than 230w/m2 are shaded on the 850 hPa chart.
Monthly mean of stream lines at 200 hPa (upper) and 850 hPa (lower) Tracks of the tropical cyclones formed in the month, if any, are superimposed. Blue numbers show identifications of tropical cyclones. Areas of OLR (outgoing longwave radiation) lower than 230w/m2 are shaded on the 850 hPa chart.
Monthly mean of stream lines at 200 hPa (upper) and 850 hPa (lower) Tracks of the tropical cyclones formed in the month, if any, are superimposed. Blue numbers show identifications of tropical cyclones. Areas of OLR (outgoing longwave radiation) lower than 230w/m2 are shaded on the 850 hPa chart.