Download
1 / 18
180 likes | 200 Views
Explore multi-attribute utility theory, mapping world properties to utility, perception accuracy, cognitive learning, social conflicts, rational mate choice, belief modeling, and posterior probabilities. Learn how to compute and interpret probabilities in various scenarios.

E N D
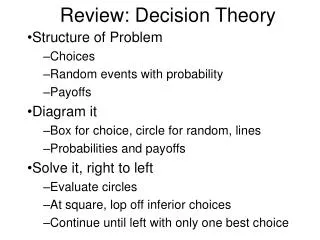
Decision Theory II PSY 5018H: Math Models Hum Behavior, Prof. Paul Schrater, Spring 2005
Multi-attribute Utility Hopefully fi(xi) are simply like addition PSY 5018H: Math Models Hum Behavior, Prof. Paul Schrater, Spring 2005
Mapping world properties onto Utility Some candidate utility measures Perception: Correctness of inferences (Signal detection theory) Perceived energy expenditure (Berkeley’s proposal) Action success (e.g. Grasp stability (end point accuracy)) Energy expenditure, number of actions Cognitive Learning- Generalization error Problem solutions- Number of possibilities, conditionals Social Number of conflicts, number of resources PSY 5018H: Math Models Hum Behavior, Prof. Paul Schrater, Spring 2005
Perceiving energy expenditure? Do hills look steeper when you are tired? Distances farther when laden? PSY 5018H: Math Models Hum Behavior, Prof. Paul Schrater, Spring 2005
Utility functions for attractiveness? But what’s the use in beauty? Money? What else is there? PSY 5018H: Math Models Hum Behavior, Prof. Paul Schrater, Spring 2005
Rational Mate Choice? PSY 5018H: Math Models Hum Behavior, Prof. Paul Schrater, Spring 2005
Modeling Belief • How much do you believe it will rain? • How strong is your belief in democracy? • How much do you believe Candidate X? • How much do you believe Car x is faster than Car y? • How long do you think you will live? PSY 5018H: Math Models Hum Behavior, Prof. Paul Schrater, Spring 2005
After your yearly checkup, the doctor has bad news and good news. The bad news is that you tested positive for a serious disease, and that the test is 99% accurate (i.e. the probability of testing positive given that you have the disease is 0.99, as is the probability of testing negative given that you don't have the disease). The good news is that this is a rare disease, striking only one in 10,000 people. Why is it good news that the disease is rare? What are the chances that you actually have the disease? PSY 5018H: Math Models Hum Behavior, Prof. Paul Schrater, Spring 2005
Posterior Probabilities • Knowing right prob to compute! • P(s|O) = P(O|s)P(s)/P(O) • s = world property • O = Observation • Example: Medical Testing • You test positive for cancer • A doctor tells you that the test only misses 10% of people who have cancer, so prepare for the worst • Do you seek a second opinion? Why? PSY 5018H: Math Models Hum Behavior, Prof. Paul Schrater, Spring 2005
Mr. Dupont is a professional wine taster. When given a French wine, he will identify it with probability 0.9 correctly as French, and will mistake it for a Californian wine with probability 0.1. When given a Californian wine, he will identify it with probability 0.8 correctly as Californian, and will mistake it for a French wine with probability 0.2. Suppose that Mr. Dupont is given ten unlabelled glasses of wine, three with French and seven with Californian wines. He randomly picks a glass, tries the wine, and solemnly says: "French". What is the probability that the wine he tasted was Californian? PSY 5018H: Math Models Hum Behavior, Prof. Paul Schrater, Spring 2005
Mr. Dupont is a professional wine taster. When given a French wine, he will identify it with probability 0.9 correctly as French, and will mistake it for a Californian wine with probability 0.1. When given a Californian wine, he will identify it with probability 0.8 correctly as Californian, and will mistake it for a French wine with probability 0.2. Suppose that Mr. Dupont is given ten unlabelled glasses of wine, three with French and seven with Californian wines. He randomly picks a glass, tries the wine, and solemnly says: "French". What is the probability that the wine he tasted was Californian? P(C|Rf) = P(Rf|C) p( C )/P(Rf) = 0.2*0.7/Sw P(Rf |w)p(w) = 0.2*0.7/(0.9*0.3+0.2*0.7) = 0.3415 = 0.2*0.7/0.41 = 0.3415 F C Rf Rc P(F) = 0.3; P(C) = 0.7; PSY 5018H: Math Models Hum Behavior, Prof. Paul Schrater, Spring 2005
Graphical Models Nodes store conditional Probability Tables A Arrows represent conditioning B C This model represents the decomposition: P(A,B,C) = P(B|A) P(C|A) P(A) What would the diagram for P(B|A,C) P(A|C) P( C) look like? PSY 5018H: Math Models Hum Behavior, Prof. Paul Schrater, Spring 2005
Sprinkler Problem You see wet grass. Did it rain? PSY 5018H: Math Models Hum Behavior, Prof. Paul Schrater, Spring 2005
Sprinkler Problem cont’d 4 variables: C = Cloudy, R=rain; S=sprinkler; W=wet grass What’s the probability of rain?Need P(R|W) Given: P( C) = [ 0.5 0.5]; P(S|C) ; P(R|C); P(W|R,S) Do the math: Get the joint: P(R,W,S,C) = P(W|R,S) P(R|C) P(S|C) P( C) Marginalize: P(R,W) = SSSC P(R,W,S,C) Divide: P(R|W) = P(R,W)/P(W) = P(R,W)/ SR P(R,W) PSY 5018H: Math Models Hum Behavior, Prof. Paul Schrater, Spring 2005
Continuous data, discrete beliefs PSY 5018H: Math Models Hum Behavior, Prof. Paul Schrater, Spring 2005
Continuous data, Multi-class Beliefs PSY 5018H: Math Models Hum Behavior, Prof. Paul Schrater, Spring 2005
Decision Theory Applied to Human Behavior PSY 5018H: Math Models Hum Behavior, Prof. Paul Schrater, Spring 2005
Continuous data, continuous beliefs • Orientation of an object • Shape • Attractiveness • Positions • Forces • Time • Most things PSY 5018H: Math Models Hum Behavior, Prof. Paul Schrater, Spring 2005