Download
1 / 22
230 likes | 395 Views
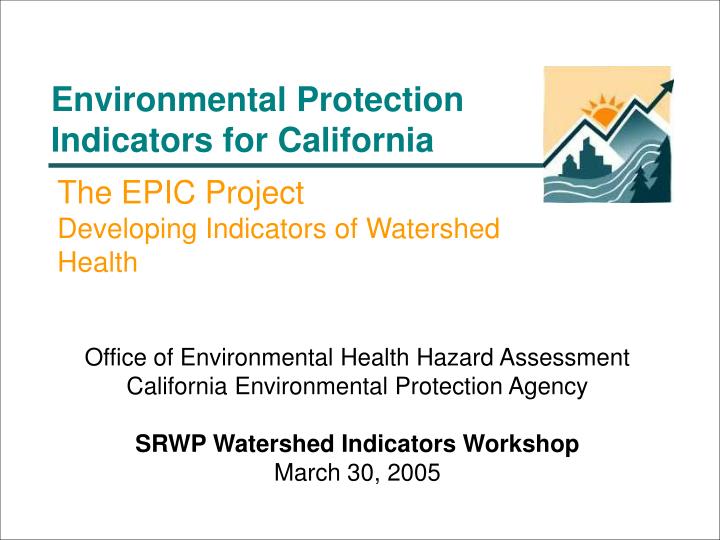
Environmental Protection Indicators for California. The EPIC Project Developing Indicators of Watershed Health. Office of Environmental Health Hazard Assessment California Environmental Protection Agency SRWP Watershed Indicators Workshop March 30, 2005.

E N D
Environmental Protection Indicators for California The EPIC Project Developing Indicators of Watershed Health Office of Environmental Health Hazard Assessment California Environmental Protection Agency SRWP Watershed Indicators Workshop March 30, 2005
Environmental indicators can be used to… • Track changes in the environment • Communicate environmental information • Provide early warning signals What is happening? • Identify or validate cause and effect Why is it happening? • Evaluate performance Are our strategies working? • Support “results-based management” How can we better accomplish our goals?
What is anenvironmental indicator? Objective, scientifically based measure that presents information on the status of, and trends in environmental releases, conditions, or effects.
US EPA definition • An indicator is a sign or signal that relays a complex message, potentially from numerous sources, in a simplified and useful manner. • An ecological indicator is defined here as a measure, an index of measures, or a model that characterizes an ecosystem or one of its critical components. An indicator may reflect biological, chemical or physical attributes of ecological condition.
Amount of information Degree of synthesis Indicator Analyzed Data Primary Data The Information Pyramid Index
State Effects Response Pressure Stresses placed on the environment by human activity or natural causes Government or societal actions Condition of the environment, human or ecological health Conceptual model:Pressure-State-Response Source: Organisation for Economic Cooperation and Development
BLUE CRAB TOTAL PHOSPHORUS Hierarchy of Indicators This is how we measure environmental change Environmental Administrative LEVEL 4 Changes in Ambient Conditions LEVEL 6 Changes in Health, Ecology, or Other Effects LEVEL 3 Changes in Discharge/ Emission Quantities LEVEL 1 Actions by EPA/State Regulatory Agencies LEVEL 2 Responses of the Regulated & Nonregulated Community LEVEL 5 Changes in Uptake and/or Assimilation Source: Chesapeake Bay Program, Environmental Indicators: Measuring our Progress (www.chesapeakebay.net)
Performance Measures • A quantitative or qualitative indicator for assessing the achievement of an objective or organizational goal. • Can be used as a metric for administrative or environmental indicator
EPIC….how we got the ball rolling • Two day conference to solicit ideas on key issues and sub-issues (day 1) and indicators to represent the issues (day 2). • Sub-committees formed for major topics: air quality, pesticides, human health, eco health, etc.
EPIC ……getting the ball rolling • Drawing on expertise of sub-committee members, winnowed down list to key issues and indicators • Filtered indicators using criteria • Final indicator set selected • Never had time for a good peer-review
Air qualityWaterLand/Waste/Materials ManagementHuman HealthEcosystem HealthPesticidesTransboundary How can these be measured? Are criteria met? Adequate data available(Type I) EPIC Indicator Selection Process What are the environmental issues? Further data collection or analysis needed(Type II) No data; conceptual(Type III)
Indicator Selection: Primary criteria • Data qualitybased on scientifically valid data collection • Representativenessreflects the environmental issue for which it was selected • Sensitivitydetects meaningful differences in environmental conditions (signal:noise) • Decision supportsupplies information that can support decision-making
Indicator Selection: Secondary criteria • Anticipatorycan provide an “early warning” • Data comparabilitycan be compared to indicators in other systems • Cost-effectivereasonable cost to collect data required to support the indicator • Benchmark valuepoint of reference enables users to assess the indicator’s significance
Key issues Habitat quantity Habitat quality Biodiversity Aquatic ecosystems indicators Land use/land cover Central valley chinook Least tern Lake Tahoe clarity Benthic macroinvert index Endocrine disruptors POPs in marine mammals Ecosystem Health Indicators
Human Health Indicators • Concentrations of toxic chemicals in blood & other tissues is key issue • POPS, lead, mercury • Extremely difficult to identify indicators of the effects of environmental exposures and human health • Numerous variable contribute to ‘health’ • State biomonitoring program’s goal is to determine exposure and possible effects
US EPA Aquatic Habitat Indicators • Stream size – channel dimensions • Channel gradient • Channel substrate size and type • Habitat complexity and cover • Riffles, pools, rocks, fallen trees, undercut banks • Riparian vegetation cover and structure • Anthropogenic alterations in stream channel and riparian zone • Channel-riparian interactions • Posted at: www.epa.gov/owow/monitoring/calm.html
2002 World Summit on Sustainable Development Indicators for Biodiversity • Trends in abundance & distribution of selected species • Extent of wetlands & large water bodies • Catchment condition – extent of riparian vegetation • Management effectiveness of protected areas • Investment in protected areas • Change in status of threatened species • Area of forest, ag, aquaculture under sustainable management
2002 World Summit on Sustainable Development Indicators for Biodiversity • Number and cost of alien invasions • Water quality • Freshwater trophic index • Number of dams • Sediment load in rivers • Pesticide use/unit agricultural harvest • Hit rates for biodiversity websites Balmford et al., 2005. The Convention on Biological Diversity’s 2010 Target, Science, 307: 212-213.
Examples of indicators of community response • Measure of extent of use of BMPs in ag • Number of watershed groups – or a measure of activities of watershed groups – or watershed plans • Existence of HCCP in region • % of communities with ordinances requiring use of low impact development technologies • Municipalities with integrated water management plans • % of river miles covered by multi-purpose flood control projects
Hierarchy of Indicators This is how we measure environmental change Environmental Administrative LEVEL 4 Changes in Ambient Conditions LEVEL 6 Changes in Health, Ecology, or Other Effects LEVEL 3 Changes in Discharge or environ. alterations LEVEL 1 Actions by EPA/State Regulatory Agencies LEVEL 2 Responses of the Regulated & Nonregulated Community LEVEL 5 Changes in Uptake and/or Assimilation SRWP Educational programs % bank with armor Population of young fish Acres riparian area/mi waterway Collaborative efforts to establish multi-purpose flood projects OR Miles of greenway/mi waterway
Two issues to consider in developing an indicator system for the SRWP • Value of including both environmental and administrative indicators • Consider effects of environment conditions on human uses and needs (not just health) as well as effects on the ecosystem.