Download
1 / 28
280 likes | 388 Views
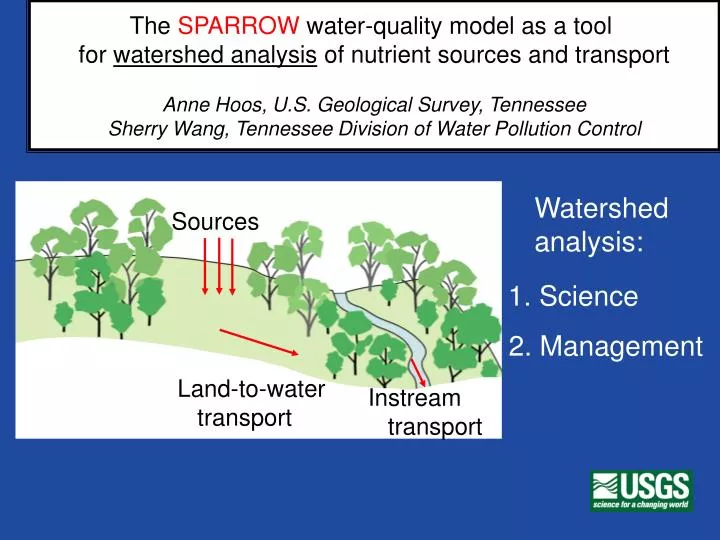
The SPARROW water-quality model as a tool for watershed analysis of nutrient sources and transport Anne Hoos, U.S. Geological Survey, Tennessee Sherry Wang, Tennessee Division of Water Pollution Control. Sources. Land-to-water transport. Instream transport. Watershed analysis:.

E N D
The SPARROW water-quality model as a tool for watershed analysis of nutrient sources and transport Anne Hoos, U.S. Geological Survey, Tennessee Sherry Wang, Tennessee Division of Water Pollution Control Sources Land-to-water transport Instream transport Watershed analysis: 1. Science 2. Management
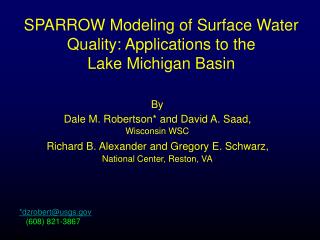
SPARROW background • SPAtially-Referenced Regression On Watershed Attributes • Developed (~1995-ongoing) by USGS,applied on a national scale (1987 conditions)http://water.usgs.gov/nawqa/sparrow/ • Applied at regional scales (New England, Chesapeake, Interior Low Plateau) in collaboration with water-quality management authorities
SPARROW modeling in Tennessee/Alabama • Interior Low Plateau ecoregion, in collaboration with Tennessee Division of Water Pollution Control • In development: southeastern U.S. (NAWQA Major River Basin program)
Examples of the basin-scale questions SPARROW can address 1. Assess water quality: What is the annual mean load and concentration of total nitrogen in the Elk River at its confluence with Tennessee River? 5,500 tons per year, 1.5 mg/L
Examples of basin-scale questions SPARROW can address 1. Assess water quality2. Establish linkage between source inputs and instream flux: What portion of annual instream load is contributed by wastewater (versus atmospheric deposition, fertilizer applied to cropland, urban land, etc.)? 3%
Examples of basin-scale questions SPARROW can address 1. Assess water quality2. Establish linkage between source inputs and instream flux 3. Track flux from upstream origin to downstream destination: What portion of the annual load was contributed by Tennessee watersheds (versus Alabama watersheds)? 85%
How certain are the answers? • A strong advantage for its use in management decisions: estimate of uncertainty calculated for all model output 1. Annual mean load = 5,500 tons per year;95% confidence interval: 4,150 – 7,950 tons (error ~20%)2. Portion of annual load contributed by wastewater from all watersheds upstream = 3 percent; 95% confidence interval: 1 – 7 percent
What is SPARROW? SPAtially-Referenced Regression On Watershed Attributes Response variable: measured load at monitoring stations Predictor variables: measured watershed attributes “Expensive” information “Inexpensive” information
“Moving from Monitoring to Prediction” Point-level water-quality data Predictions for unmonitored, comparable areas
SPARROW model structure for Ecoregion 71 Network of stream reaches and associated catchment • Average reach length ~8 miles • Average catchment area ~30 sq mi
Stream load Sources Land-to-water delivery Instream decay Error Sources Land-to-water delivery Instream decay http://water.usgs.gov/nawqa/sparrow
Stream load Sources Land-to-water delivery Instream decay Error Source variables: wastewater load, applied fertilizer, animal waste, atmospheric deposition, urban area
Stream load Sources Land-to-water delivery Instream decay Error Delivery variables: (landscape characteristics) air temperature *, soil permeability, slope, drainage density
Stream load Sources Land-to-water delivery Instream decay Error Instream decay variables (waterbody characteristics) reservoir residence time *, stream depth, stream-reach travel time
Calibrating SPARROW model for Ecoregion 71: Results (draft) for nitrogen Fit statistics: r2 = 0.9, RMSE = 0.2 (average prediction error = 20 percent)
SPARROW Total Phosphorus Model (Draft) Elk River Basin (Tenn., Ala.) Phosphorus entering stream network from incremental watershed, tons/sq.mile/year Annual mean concentration (model predicted): 0.6 mg/L
SPARROW Total Phosphorus Model (Draft) Elk River Basin (Tenn. Ala.)
SPARROW Total Phosphorus Model (Draft) Elk River Basin (Tenn. Ala.)
SPARROW Total Nitrogen Model (Draft) Elk River Basin (Tenn. Ala.)
Main Ideas • The SPARROW water-quality model is a tool for addressing basin-scale questions about stream nutrient loads/concentrations (assess water quality, source shares, track flux from upstream origin to downstream target) • A strong advantage for its use in management decisions – estimate of uncertainty(percent error for Ecoregion 71 models: 20% for nitrogen, 60% for phosphorus)
Coeff. 1.1 x 0.7 x 0.2 x 0.1 x 11 x Calibrated coefficients establish the linkage (average) between source inputs and instream flux
SPARROW Total Phosphorus Model (Draft) Elk River Basin (Tenn., Ala.) Phosphorus entering stream network from incremental watershed, tons/sq.mile/year Phosphorus delivered to target waterbody from incremental watershed