Download
1 / 38
380 likes | 394 Views
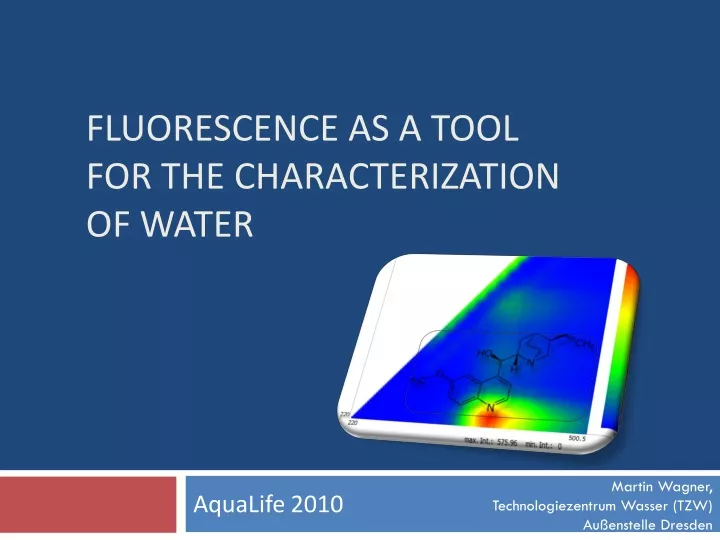
Fluorescence as a tool for the characterization of water. Martin Wagner, Technologiezentrum Wasser (TZW) Außenstelle Dresden. AquaLife 2010. Outline. Principles of fluorescence spectroscopy Characterization of DOC Problems in quantification of fluorescence signals.

E N D
Fluorescence as a tool for the characterization of water Martin Wagner, Technologiezentrum Wasser (TZW) Außenstelle Dresden AquaLife 2010
Outline • Principles of fluorescence spectroscopy • Characterization of DOC • Problems in quantification of fluorescence signals
Measurement offluorescence • Design of a fluorescence spectrometer I. Principles of fluorescence spectroscopy
Measurement offluorescence • Emission spectrum: λEx = const., λEm I. Principles of fluorescence spectroscopy
Measurement of fluorescence • Variation of λEx produces an excitation-emission-matrix, called EEM Intensity λEmission λExcitation I. Principles of fluorescence spectroscopy
HS Characterizationofwater Chl a Chl A Chlorophyll A PC Phycocyanin PE Phycoerythrin FC Fucoxanthin Tyr Tyrosine Trp Tryptophane Phe Phenylalanine EPS extracellular polymeric substances FS fulvic acid like HS humic acid like Q-o Quinone (oxidized) Q-s Semiquinone Q-h Hydroquinone Bak bacteria like fluorescence PC PE FC Humic substances Chl a FC Chl a Biopolymers EPS Algae pigments Q-s Q-s/h Q-s EPS Trp Tyr Q-s Q-s/h Bak FS Q-o Q-o Tyr Trp Phe II. Characterization of DOC
Characterizationby LC-OCD • Most parameters used to describe DOC are sum parameters (like BOD, COD, UV254, UV436) • LC-OCD (Liquid chromatography – Organic carbon detection) and fluorescence allow the characterization of DOC • LC-OCD separates DOC by molecular weight • Fluorescence separates DOC by chemical structure or rather chemical properties II. Characterization of DOC
Quantificationoffluorescence • Fluorescence is easy to use and is appropriated for the characterization of the DOC • The quantification isn’t easy, because of • Influence of stray light • Inner – Filter - Effects • Quenching of fluorescence signals • Portability: standardization between different spectrometers • Spectral overlapping of signals III. Problems in quantification of fluorescence signals
Straylight • Caused by scattering of exciting light in sample • Differentiation between Rayleigh- and Ramanscattering • Rayleigh: elastic scattering without loss of energy • Appears at excitation wavelength • Raman: inelastic scattering with loss of energy • Appears at longer wavelengths III. Problems in quantification of fluorescence signals
Straylight III. Problems in quantification of fluorescence signals
Straylight III. Problems in quantification of fluorescence signals
Solution ofstraylightproblem • Best method is the use of cutoff filters III. Problems in quantification of fluorescence signals
Solution ofstraylightproblem • Best method is the use of cutoff filters III. Problems in quantification of fluorescence signals
Inner – Filter – Effects (IFE) • Primary IFE: absorption of excitating light by sample • Secondary IFE: absorption of emitted light III. Problems in quantification of fluorescence signals
Absorption 3 2.5 2 absorption 1.5 1 0.5 0 200 300 400 500 600 700 wavelength [nm] Solution ofthe IFE-Problem • Generally there are two methods: • Additionally measurement of absorption spectrum of sample • Correction via stray light peaks of the sample (Raman peak) Lakowicz (2006): III. Problems in quantification of fluorescence signals
Solution ofthe IFE-Problem III. Problems in quantification of fluorescence signals
Solution ofthe IFE-Problem • Result of IFE-correction is a linear relationship III. Problems in quantification of fluorescence signals
Quenching • Is also a decrease of fluorescence intensity • Results from contact between fluorophor and quenching molecule • Dynamic Quenching: collision between molecules in excited state • High temperatures and high concentrations increase the probability of collisions • Static Quenching: formation of complex between fluorophore and quencher • Fluorophore isn‘t able to fluoresce any more III. Problems in quantification of fluorescence signals
Quenching: an example III. Problems in quantification of fluorescence signals
Solution of Quenching-Problem • Relationship between fluorophore and Quencher can be described by the Stern-Volmer-Law III. Problems in quantification of fluorescence signals
Solution of Quenching-Problem • Definition of the most important Quenchers in respect of raw and drinking water • O2, Cl-, NO3- (surface- and groundwater) • Fulvic acid • Humic acid • Methodical laboratory tests to derive the single quenchingconstants for every fluorophore-quencher-pair III. Problems in quantification of fluorescence signals
Proteinfluorescence at two spectrometers 400 350 LS50 LS55 300 250 fluorescence intensity [a.u.] 200 150 100 50 0 240 340 440 540 640 emission wavelength [nm] Portability III. Problems in quantification of fluorescence signals
Portability • The reason for the differences is the missing reference photomultiplier for the emission channel III. Problems in quantification of fluorescence signals
Solution ofPortability-Problem • Standardization in three steps: • Correction of exciting light: is included in all spectrometers (reference photomultiplier) • Correction of deformed peaks: via derivation of correction-function with the use of reference dyes • Normalization of signals via external standard (sealed pure water cuvette) III. Problems in quantification of fluorescence signals
Solution ofPortability-Problem • Correction of deformed peaks via reference dyes Lakowicz (2006) III. Problems in quantification of fluorescence signals
Solution ofPortability-Problem III. Problems in quantification of fluorescence signals
Short summary • Wehavelearned • How a spectrometerdoeswork • Howthe DOC ischaracterizedby • Fluorescence • LC-OCD method • How a quantificationiscomplicatedby • Straylight • Inner – Filter – Effects • Quenching • Portability III. Problems in quantification of fluorescence signals
Spectraloverlapping III. Problems in quantification of fluorescence signals
Spectraloverlapping • Existing multivariate methods are: • Principal components regression (PCR) • Parallel factor analysis (PARAFAC) III. Problems in quantification of fluorescence signals
Principalcomponentsregression (PCR) • Need for set of EEM‘s for decomposition training dataset New matrix DOC: 1,2 mg/L DOC: 0,4 mg/L DOC: 0,6 mg/L … … … Collection of samples about one year Quantification of the new matrix III. Problems in quantification of fluorescence signals
Principalcomponentsregression (PCR) • Comparison between „classical“ calibration and calibration using principal components • Principal components are difficult to interpret • Appropriate for quantification of well known waters, not for characterization III. Problems in quantification of fluorescence signals
20 to ~ 200 Parallel factor analysis (PARAFAC) • Some kind of „extended“ principal components analysis III. Problems in quantification of fluorescence signals
Multivariate analysis • Lack of interpretation (PCA/PCR) • No universal application possible • New calibration for every location or water necessary • High number of samples necessary • PCR mainly applied in process-monitoring (e.g. brewery), where water always has the same defined composition and may only exhibits fluctuation of concentration III. Problems in quantification of fluorescence signals
Approach of TZW tosolvetheproblem • Target is decomposition based on one EEM • Extended curve fitting approach is used • Allows to remove stray light, if cutoff filters weren‘t able to remove them Tryptophan fitted with an asymmetric curve and stray light with symmetric curves III. Problems in quantification of fluorescence signals
Approach of TZW tosolvetheproblem • Main problem is finding the truth, because several solutions are possible III. Problems in quantification of fluorescence signals
Approach of TZW tosolvetheproblem • Principle of fluoresence: λem = constant • Usage of pattern recognition (DTW) III. Problems in quantification of fluorescence signals
Summary • Advantages • Quick • Little sample preparation • Very sensitive • Disadvantages • Complexity of data evaluation and interpretation
The End Thank you for your attention