Download
1 / 30
300 likes | 482 Views
Sylvia Murphy Don Middleton Mary Haley National Center for Atmospheric Research Computational and Information Systems Laboratory Boulder, Colorado SC2008 Austin, Texas November 15-21, 2008. Community Analysis and Visualization Tools for the Geosciences.

E N D
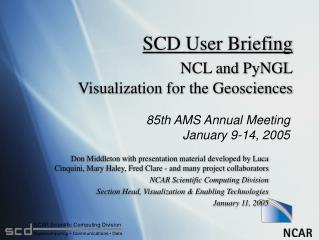
Sylvia Murphy Don Middleton Mary Haley National Center for Atmospheric Research Computational and Information Systems LaboratoryBoulder, Colorado SC2008 Austin, Texas November 15-21, 2008 Community Analysis and Visualization Tools for the Geosciences
Community and open source tools and environments • Earth System GridEnables analysis of and knowledge development from global Earth System models • NCAR Command LanguageScripting language designed for scientific data analysis and visualization • PyNGLPython interface to NCL’s graphics library • PyNIOPython interface to NCL’s file I/O library
Challenges in climate, weather, and environmental research Datasets are globally distributed and growing in size and complexitypetabytes exabytes How to provide effective access and analyses across geoscientific tools and environments? Growing international community presents unique requirements Need to train users worldwide to get the most out of their research in these complex environments
The ESKE Science Gateway Framework • The Science Gateway Framework is aimed at providing common infrastructure for a range of distributed, federated data management efforts • ESG: will deploy the SGF for an early testbed for IPCC AR5/CMIP5 this Fall • ASP/DyCore Workshop: A Curator, ESG, and SGF collaboration to provide a system that spans models, data, and tools • CADIS: A new prototype Gateway for polar research is undergoing review
NCAR Command Language (NCL) • Reads many data formats popular in geosciences • Remote access to data • Hundreds of analysis functions • Publication-quality visualizations • Several workshops yearly • Knowledgeable consulting • Supported on UNIX systems • Binaries provided • Open source NCL graphic by Dennis Shea, NCARWheeler-Kiladis Space-Time Spectra
NCL Visualizations • High-quality and customizable visualizations • Contours, XY, vectors, streamlines, maps • Specialized scripts for skew-T, wind roses, histograms, taylor diagrams, bar charts, meteograms • Over 1,400 graphical options available Terrain rasters: Mark Stevens Meteogram: John Ertl, FNMOC
PyNGL (“pingle”) • Python interface similar to NCL graphical interfaces • Same publication-quality graphics as NCL • Supports NumPy MaskedArrays • Some geoscientific data analysis functions • Online tutorial Open sourceAugust 2008 PyNGL graphic showing nested grids Ufuk TuruncogluIstanbul Technical University Turkey ClimateChange Scenarios
PyNIO(“pie-nee-oh”) • Reads/writes same formats as NCL • Excellent GRIB 1 & 2 reader • Easy-to-use interface • Unified NetCDF-like view of all data formats • Supports NumPy MaskedArrays • Extensive subscripting capability • Open source, August 2008 import Nioncdf = Nio.open_file(“file.nc”,”r”) ngrb = Nio.open_file(“RUC.grb”,”r”)
What’s coming in NCLV5.0.1 – December 2008 • Major map database overhaul • Much more accurate outlines • New state/province outlines for China, India, and Brazil, ice shelves of Antarctica • New projections • Many updates to GRIB 1 & 2 readers(one of the best GRIB readers) • Several new analysis functions • Wheeler-Kiladis space-time spectra • MJO [Madden-Julian Oscillation] diagnostics • Special focus on analyzing WRF-ARW data
What’s new in PyNGL/PyNIOAugust 2008 • First open source version • PyNIO and PyNGL released as separate packages • Support for NumPy masked arrays • Extensive subscripting added to PyNIO • Several new PyNGL and PyNIO examples • Map database updated (same as for NCL)
Future plans for NCL, PyNIO, PyNGL • More I/O formats and functionality: • Handle large (> 2Gb) arrays • NetCDF 4, HDF5, HDFEOS 5 • Datasets aggregated from multiple files • Supplement display model • larger color maps, transparency, anti-aliasing, image formats, more font support • More analysis functions • Streamlines/vectors on triangularmeshes • Collaborative projects • VAPOR, WRF, CCMval, CCSM, ESG
http://www.mmm.ucar.edu/wrf/OnLineTutorial/Graphics/NCL/ Sample WRF-ARW visualizationsScripts maintained by Cindy Bruyere, NCAR/MMM
Taylor diagram Courtesy of Dennis Shea and Adam Phillips, CGD
A T-S diagram is a graph showing the relationship between temperature and salinity as observed together at, for example, specified depths in a water column. Isopleths of constant density are often also drawn on the same diagram as a useful additional interpretation aid. In the ocean, certain T-S combinations are preferred, leading to the procedure of identification via the definition of water types and water masses and their distributions.Image contributed by Christine Shields,NCAR/CGD.
Madden Julian Oscillation Climate Variability Image courtesy of Dennis Shea, NCAR
Evans plot: (Jason Evans, Yale University)A way to visualize spatially, two variables of interest, one of which provides some measure of "importance".
NCL image courtesy ofChristine Shields, CGD Paleogeography data courtesy David Rowley, PGAP
Image courtesy Dave Brown POP Grid
Connectivity graphs from a biological neural network model. Trevor Law, Univ of California @ Irvine
Will be able to import PNG images andoverlay on other projections
Types of special grids that NCL and PyNGL can contour(using triangular meshes) Coming soon: vectors and streamlines on non-uniform grids
ARPEGE GRID(Meteo France) Christophe Cassou (CNRS/CERFACS) Similar to ISCCP grid, but with somewhat finer resolution. Grid is rotated with respect to the globe so as to put its poles somewhere other than at the North and South Pole.
Data from Dave Randall, Todd Ringler, Ross Heikes of CSU Most geodesic grids appear to be formed by elaborating an icosahedron; each of the 20 faces of the icosahedron is subdivided into smaller triangles in a more or less obvious way.
This grid could be described as a tripole grid that is further modified by the arbitrary displacement of some portions of the grid to achieve finer resolution over areas of interest (typically, ocean areas). Christophe Cassou (CNRS/CERFACS)
Triangular meshTom Gross NOAA/NOS/CSDL/MMAP
Curly vectors on a triangular meshto be added to NCL/PyNGL FY2009
Questions? Earth System Gridhttp://www.earthsystemgrid.org NCAR Command Languagehttp://www.ncl.ucar.edu PyNGL and PyNIO http://www.pyngl.ucar.edu Sylvia Murphy (murphys@ucar.edu) Don Middleton (don@ucar.edu) Mary Haley (haley@ucar.edu)


![Geoneutrino Radiometric Analysis For Geosciences [GRAFG]](https://cdn2.slideserve.com/4382941/slide1-dt.jpg)