Download
1 / 57
570 likes | 806 Views
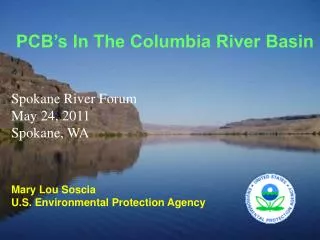
Climate Change in the Columbia Basin. Sediment coring in alpine environments. Climate Change in the Columbia Basin. Presentation Overview : Introduction to climate science - variability and extremes. Projected future climate for the Basin.

E N D
Climate Change in the Columbia Basin
Climate Change in the Columbia Basin Presentation Overview: Introduction to climate science - variability and extremes. Projected future climate for the Basin. Some implications for our land, water and communities.
Warming has Temporal Variability Climate Variability Short term: (years to decadal) ups and downs about the trend line (e.g. El Niño/La Niña) Temperature About 20C Time
Warming has Temporal Variability Climate Variability Short term: (years to decadal) ups and downs about the trend line (e.g. El Niño/La Niña) Plus decadal-scale trends About 20C
Average Annual Temperature has Increased Over the Last Century Climate Change Long-term trends or major shifts in climate (multi-decadal to century-scale) 9 C0 8 7 6 5 0.7 to 1.70 C at weather stations across the Basin 4 1913 1933 1953 1973 1993
Average Annual Temperature has Increased over the Last Century …and is impacting the frequency of extreme events 9 C0 8 7 6 5 Data from Basin 4 1913 1933 1953 1973 1993
Probability of occurrence Increase in Mean Temperature Historical Climate Cold Average Hot
Probability of occurrence Increase in Mean Temperature More hot weather Historical Climate More Record hot weather Less cold weather New Climate Cold Average Hot
Probability of occurrence Increase in Variance Historical Climate More hot weather More cold weather New Climate Cold Average Hot More record cold weather More record hot weather
Probability of occurrence Increase in Mean Temperature & Variance Historical Climate Cold Average Hot
Probability of occurrence Increase in Mean Temperature & Variance and record hot weather Much more hot weather Historical Climate Less change In cold weather New Climate Cold Average Hot
The Data 0.1 – 0.2 % 4 – 13 %
Warming has Spatial Variability * Temperature Anomaly 0C
Warming has Spatial Variability * Temperature Anomaly 0C
Warming has Spatial Variability * * * Temperature Anomaly 0C
Warming has Spatial Variability * Temperature Anomaly 0C
Warming has Spatial Variability * * Temperature Anomaly 0C
“Prediction is very difficult, especially about the future.” Yogi Berra
National Academy of SciencesNational Academy of EngineeringInstitute of MedicineNational Research Council SCIENTIFIC CONSENSUS “Most of the warming over the last several decades can be attributed to human activities that release carbon dioxide (CO2) and other heat-trapping greenhouse gases (GHGs) into the atmosphere.” “The burning of fossil fuels—coal, oil, and natural gas—for energy is the single largest human driver of climate change.”. “Human-induced climate change and its impacts will continue for many decades, and in some cases for many centuries.”
300 280 260 240 CO2 (ppm) 220 200 180 600,000 500,000 400,000 300,000 200,000 100,000 0 Age (yr BP))
1 300 280 260 240 CO2 (ppm) 220 200 180 600,000 500,000 400,000 300,000 200,000 100,000 0 Age (yr BP))
Projections 2100 AD CO2 (450-1100) CH4 (1500-3700) Today 393ppm “Natural Range” CO2 100 yr 300 280 CO2 (ppm) 240 200 600,000 500,000 400,000 300,000 200,000 100,000 0 Age (yr BP) Petit et al. (1999) Nature 399:429-436
National Academy of SciencesNational Academy of EngineeringInstitute of MedicineNational Research Council Understanding and responding to climate change (Highlights of National Academies Reports, 2008) Advancing the Science of Climate Change, America's Climate Choices: Panel on Advancing the Science of Climate Change; National Research Council (2010)
5 4 Projections 2100 AD 3 2 Global Temperature (deg C) 1 ...Provides Perspective
Canadian Regional Climate Model 3.6 Change in annual mean screen (2m) temperature (°C) in 2041-2060 relative to 1971-1990 simulated by CRCM3.6.1 *
Climate Extremes in the Canadian Columbia Basin: A Preliminary Assessment (2012) Up to four times as many warm summer days and nights.
42oC 38oC
Extreme Events in the Basin Temperature or Precipitation Two to three-fold increase in the frequency of extreme precipitation events with 5-, 10- and 25-year return periods. Two to eleven-fold increase in the occurrence of 25-year record extremely hot days. Time
From Dialogue to Action Projected Impacts for the Basin e.g. Transportation
Projected Impacts for the Basin e.g. Infrastructure e.g. Transportation
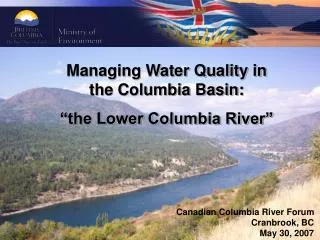
Climatic Extremes – One Example Precipitation 2012 Johnson’s Landing Impacts • 4 people killed • 4 houses destroyed • Community water system destroyed • Road destroyed • Utilities Damaged TMTV Increased Soil Moisture Decreased Soil Strength Landslide Source: Greg Utzig. www.kootenay resiliance.org
Athabasca Glacier Change in 88 years
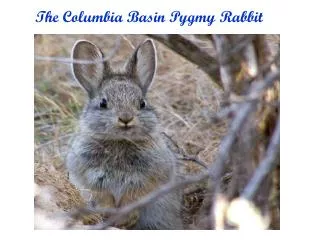
Climate Change Impacts Continuing Rapid Recession of Alpine Glaciers Ice loss at Kokanee Glacier since ca. 1870 Kokanee Glacier ice margin 2010 Approximate ice margins as of ca. 1870