Download
1 / 21
280 likes | 537 Views
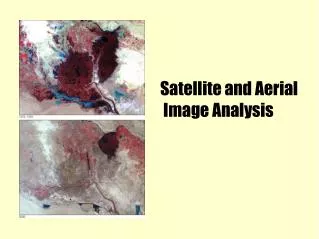
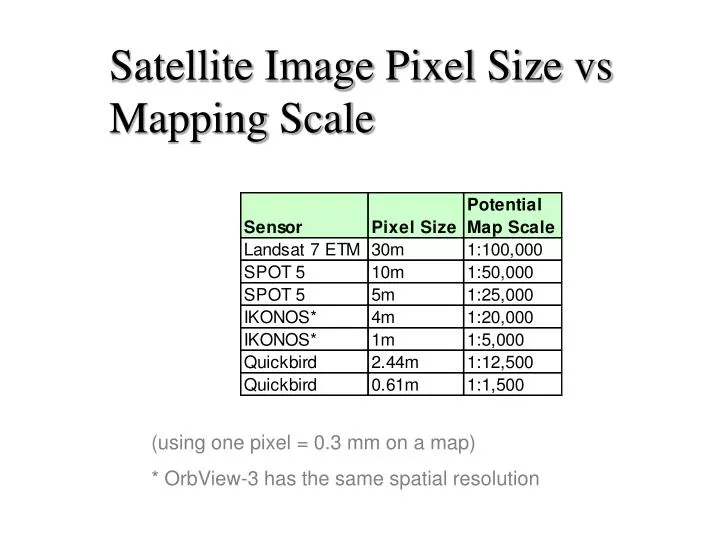
Satellite Image Pixel Size vs Mapping Scale. (using one pixel = 0.3 mm on a map) * OrbView-3 has the same spatial resolution. Landsat. SPOT-5 5m. SPOT-5. Fused image of 10m multispectral and 2.5m pan. What Is QuickBird Imagery?.

E N D
Satellite Image Pixel Size vs Mapping Scale (using one pixel = 0.3 mm on a map) * OrbView-3 has the same spatial resolution
SPOT-5 • Fused image of 10m multispectral and 2.5m pan
What Is QuickBird Imagery? • Highest ground resolution satellite data commercially available • 61cm/pixel size b/w, 2.44m/pixel size colour • Obits at 450 km • Minimum order size 272 km2 • US$29/ km2
QB-IK Change Detection Image Newly exposed areas are yellow-red and newly regenerated areas are green-blue. Areas with relatively little or no change are shown in purple tones.
Costs • Image acquisition cost • 2000 price = $0.21/ha • $3360/1:20,000 map sheet • Image will have < 20% cloud cover • Image processing/orthorectification cost • $1500 for average scene
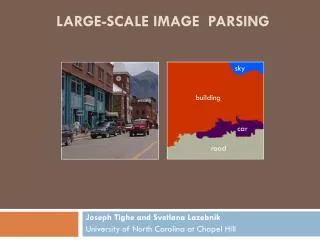
Satellite Imagery vs Aerial Photos C C C C C C C C C C
Next Generation Satellites • WorldView – launch 2006 • 50 cm panchromatic resolution • 2.0-meter multispectral resolution • Orbview-5 – launch 2007 • 41 cm panchromatic resolution • 1.64 m MSS
High Resolution Imagery - Summary • Strengths • Provide good input for mapping, inventorying, monitoring, prioritizing inspections, surveying of high priority areas • Information captured in digital format plus provides visible and NIR spectral information • Allows digital processing / interpretation / change detection • 11 bit data better for shadowed areas • Weaknesses • Cost (US$ 29/km2 for b/w + colour) • Min order size 272 km2 • Cloud cover (up to 20%) • Need to order for future date (for low demand areas)
CONCLUSIONS • High-resolution satellite imagery is a new tool that can be used cost effectively for high priority areas. • For aerial coverage - the sky is no longer the limit !
Satellite Imagery vs Aerial Photo Prices Orthorectified US$ prices (based on an area of 121 km2) Sarah R. Finley, “High-Resolution Satellite Imagery and Resource Management – Fact Sheet 3”, University of Minnesota, Dept. of Forest Resources.