Download
1 / 3
30 likes | 106 Views
Learn how to utilize pie graphs to display proportional data and bar graphs for discrete data representation. Understand how to calculate angles for pie graphs and create histograms to show grouped continuous data effectively.

E N D
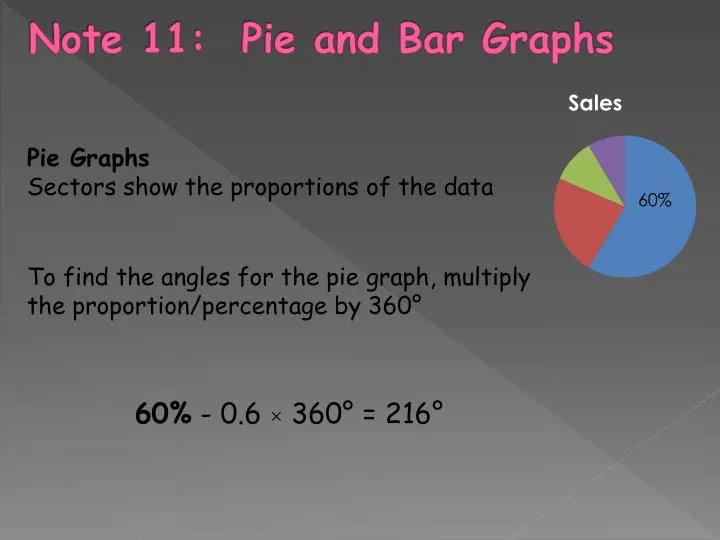
Note 11: Pie and Bar Graphs Pie Graphs Sectors show the proportions of the data To find the angles for the pie graph, multiply the proportion/percentage by 360° 60% - 0.6 × 360° = 216°
Histogram – display grouped continuous data – area represents the frequency frequency Bar Graphs – display discrete data Distance (cm) – counted data – draw bars (lines) with the same width – height represents frequency
Page 254 Exercise E and F